


Services on Demand
Article
 English (pdf)
 Article in xml format
 Article references
Indicators

Related links
-
 Cited by Google
 -
 Similars in Google
Share

 Permalink
Bothalia - African Biodiversity & Conservation
On-line version ISSN 2311-9284
Print version ISSN 0006-8241
Bothalia (Online) vol.48 n.1 Pretoria 2018
http://dx.doi.org/10.4102/abc.v48i1.2294
ORIGINAL RESEARCH
Vegetation type conservation targets, status and level of protection in KwaZulu-Natal in 2016
Debbie JewittI, II
IEzemvelo KZN Wildlife, Biodiversity Research and Assessment, South Africa
IISchool of Animal, Plant and Environmental Sciences, University of the Witwatersrand, South Africa
ABSTRACT
BACKGROUND: Systematic conservation planning aims to ensure representivity and persistence of biodiversity. Quantitative targets set to meet these aims provide a yardstick with which to measure the current conservation status of biodiversity features and measure the success of conservation actions.
OBJECTIVES: The conservation targets and current ecosystem status of vegetation types and biomes occurring in KwaZulu-Natal (KZN) were assessed, and their level of formal protection was determined, to inform conservation planning initiatives in the province.
METHOD: Land cover maps of the province were used to determine the amount of natural habitat remaining in KZN. This was intersected with the vegetation map and assessed relative to their conservation targets to determine the ecosystem status of each vegetation type in KZN. The proclaimed protected areas were used to determine the level of protection of each vegetation type.
RESULTS: In 17 years (1994-2011), 19.7% of natural habitat was lost to anthropogenic conversion of the landscape. The Indian Ocean Coastal Belt and Grassland biomes had the least remaining natural habitat, the highest rates of habitat loss and the least degree of formal protection.
CONCLUSION: These findings inform conservation priorities in the province. Vegetation type targets need to be revised to ensure long-term persistence. Business-as-usual is no longer an option if we are to meet the legislative requirements and mandates to conserve the environment for current and future generations.
Introduction
Systematic conservation planning is used globally to identify priorities for biodiversity conservation and inform policy and legislation to facilitate the long-term conservation of biodiversity (Pressey et al. 2007). Conservation planning requires planning for whole landscapes, ensuring both representivity and persistence of species, habitat types, ecosystems and the processes that maintain and create diversity (Margules & Pressey 2000). A critical component of the planning process is to set quantitative targets for biodiversity features or conservation goals. Targets reflect the conservation value of existing protected areas, inform the selection of additional areas to meet conservation goals (Margules & Pressey 2000), measure the success of conservation actions (Desmet & Cowling 2004) and allow for accountability and defensibility of conservation decisions.
In South Africa (SA), vegetation types are used as higher order biodiversity feature surrogates for species and ecosystems (Lombard et al. 2003). This coarse-filter approach covers the entire landscape and reduces the spatial and taxonomic bias associated with species data (Lombard et al. 2003; Margules & Pressey 2000). Whilst vegetation types have been found to be good surrogates for arthropods (Schaffers et al. 2008), they are not good surrogates for specialised habitat or range-restricted species, rare or threatened species and vertebrates (Lombard et al. 2003). Using vegetation types in conservation planning is therefore complementary to species data and may fill a gap where species data are scarce.
Plant communities or vegetation types underpin trophic structure and functioning (Jewitt et al. 2015a) and sequester nutrients in most ecosystems (Giam et al. 2010). These habitats support essential ecological processes and provide ecosystem services, materials and food critical for human well-being (Giam et al. 2010). However, habitat loss and land cover change are currently the leading cause of biodiversity loss worldwide (Jetz, Wilcove & Dobson 2007; MEA 2005; Vitousek 1994). Indeed, in KwaZulu-Natal (KZN), SA, 7.6% (721 733 ha) of natural habitat was lost to anthropogenic conversion in only 6 years (Jewitt et al. 2015b). Hence, there is an urgent need to assess the impact of habitat loss on vegetation types in KZN.
This article assesses the status of vegetation types and biomes in KZN based on two standardised quantitative indicators used in SA: ecosystem status (Driver et al. 2012) that compares the amount of a vegetation type remaining in a natural state to thresholds of conservation concern based on conservation targets; and levels that assess how much of each vegetation target is achieved in protected areas.
Research method and design
Study site
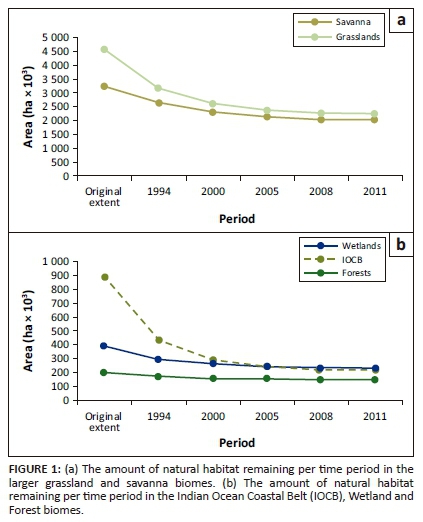
KwaZulu-Natal is a province on the east coast of SA. It has high levels of biodiversity and forms part of the Maputaland-Pondoland-Albany biodiversity hot spot with several centres of endemism [Maputaland, Pondoland (Mucina et al. 2006b), Midlands and Drakensberg Alpine (Mucina et al. 2006a)]. The KZN vegetation map provides greater detail on vegetation types and is mapped at a finer scale than the national vegetation map of Mucina and Rutherford (2006) and was used in this analysis. There are 101 vegetation types and subtypes (EKZNW 2011a) in the province and five biomes are recognised [Grassland, Savanna, Indian Ocean Coastal Belt (IOCB), Forests and Wetlands (azonal)]. Their historical extents are 4 583 855 ha, 3 259 341 ha, 891 092 ha, 202 879 ha and 393 628 ha, respectively (Figures 1 and 2a). The forest coverage reflects a more current extent, as their historical extents could not be accurately mapped. Zonal and azonal groups are recognised within the forest biome and wetlands are considered azonal. The provincial biome classification includes wetlands as a biome, which differs from the Mucina and Rutherford definition of a biome (Rutherford, Mucina & Powrie 2006). Wetlands form a major part of the landscape in KZN and have distinct floristic communities and were therefore included as a biome in this analysis.
Input data: Land cover
Five different land cover maps were used to determine the extent of habitat conversion (non-natural categories) in KZN. The 1994 (Fairbanks et al. 2000) and 2000 (Van den Berg et al. 2008) land cover maps were national maps, whilst the 2005 (EKZNW 2011b; GTI 2008), 2008 (EKZNW 2013a; GTI 2010) and 2011 (EKZNW 2013b; EKZNW & GTI 2013) land cover maps were provincial maps developed by Ezemvelo KZN Wildlife. Based on a systematic land cover change analysis for KZN (Jewitt et al. 2015b), which demonstrated the extensive categorical swopping between land cover categories, anthropogenic habitat conversion that occurred in the province was accumulated, that is, a non-natural category was not permitted to become a natural category at some future point in time. This was done specifically to identify primary natural vegetation occurring in the province rather than secondary natural vegetation, which does not harbour the same level of biodiversity as primary natural habitat (Walters, Kotze & O'Connor 2006).
The land cover maps were projected, clipped to the 2008 vegetation extent to exclude the dynamic coastal rock and sand category and clipped to the 2010 provincial boundary (EKZNW 2010). Minor corrections were made to known errors in the land cover maps. To determine the amount of natural habitat remaining, two categories were created across the five land cover maps, namely natural vegetation and features (untransformed) and non-natural vegetation (transformed or anthropogenic features such as the built environment, cropped agriculture, timber plantations, dams and mines). These were intersected with the vegetation types and biomes to determine their degree of transformation or habitat loss.
Input data: Conservation targets for vegetation types
The conservation targets were a combination of the national targets used in the national protected area expansion strategy (Government of South Africa 2009), EKZNW vegetation targets (Jewitt 2009), forest targets (Berliner 2005) and the vegetation targets in Mucina and Rutherford (2006), using the higher target where applicable. The conservation targets for the non-forest vegetation types were determined using the species-area method developed by Desmet and Cowling (2004). The forest targets follow the method of Berliner (2005) where a baseline of 15% was adjusted upwards dependent on species diversity, rarity, patch fragmentation, historic reduction and location within regions or centres of endemism based on expert consultation.
Input data: Vegetation map
The provincial vegetation map of KZN was used in this analysis (EKZNW 2011a). It is mapped at a finer scale than the national vegetation map (Mucina & Rutherford 2006). The vegetation map was clipped with the provincial boundary (EKZNW 2010).
Input data: Protected Areas map
The provincial Protected Areas from 2015 (EKZNW 2015) and proclaimed Stewardship sites (National Environmental Management: Protected Areas Act [NEM:PA] 57 of 2003) as at January 2016 (EKZNW 2016) were used to determine the level of protection for the vegetation types. The Department of Environmental Affairs maintains a register of the country's conservation estate (the South African Protected Areas Database [SAPAD]). The Protected Areas map used here differs slightly from the SAPAD map as there is a lag period between the provincial Protected Area proclamation and updating of the Surveyor General cadastres and SAPAD at a national level. Game farms and municipal reserves were not included unless proclaimed under NEM:PA.
Analysis
The land cover, vegetation map, conservation targets and protected areas map were used to calculate ecosystem status and levels of protection as described in the National Biodiversity Assessment (Driver et al. 2012). The remaining natural habitat and conservation targets informed the conservation or ecosystem status of the vegetation types. Thresholds of concern are defined as follows: Critically Endangered (≤ biodiversity target), Endangered (≤ biodiversity target + 15%), Vulnerable (≤ 60%) and Least Threatened (> 60%). The threshold for Critically Endangered is based on the vegetation type conservation target described above. Below this threshold, the basic species representation target cannot be achieved.
The level of protection represents the area of a vegetation type within protected areas relative to the conservation target. In SA, conservation targets are the target for the amount of each vegetation type that should be represented within public and private proclaimed protected areas. The levels of protection thresholds of concern are defined as follows: Fully Protected (≥ biodiversity target), Moderately Protected (≥ 10% biodiversity target), Poorly Protected (≥ 1% - < 10%), Nominally Protected (0% - < 1%) and Not Protected (0%).
Notes on the analysis
Habitat patches smaller than 4 ha were removed with the exclusion of naturally fragmented vegetation types such as forests and wetlands, as well as Drakensberg-Amathole Afromontane Fynbos, Drakensberg Afroalpine Heathland, Basotho Montane Shrubland and Lebombo Summit Sourveld. Small patches were considered unable to support the natural processes that create and maintain biodiversity, for example fire. In addition, these small patches have an increased vulnerability to stochastic events, suffer from edge effects and increased disturbances (Doherty, Kearns & Barnett 2000), limiting their long-term persistence.
Results
Between 1994 and 2011 (17 years), 19.7% of natural habitat was converted to non-natural land classes, representing an average annual loss of 1.2% (109 906 ha per annum) and a decline from 73.3% to 53.6% remaining natural. Of the 53.5% remaining natural in 2011 (Figure 2b), 7.35% was considered degraded (in terms of aerial cover as detected from satellite imagery). These degraded areas do not support the full complement of biodiversity features.
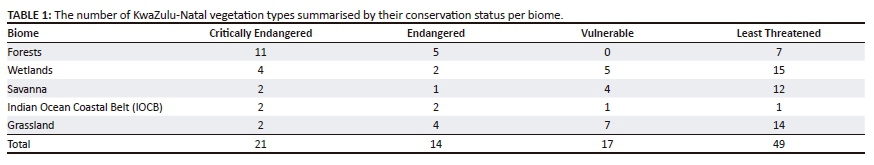
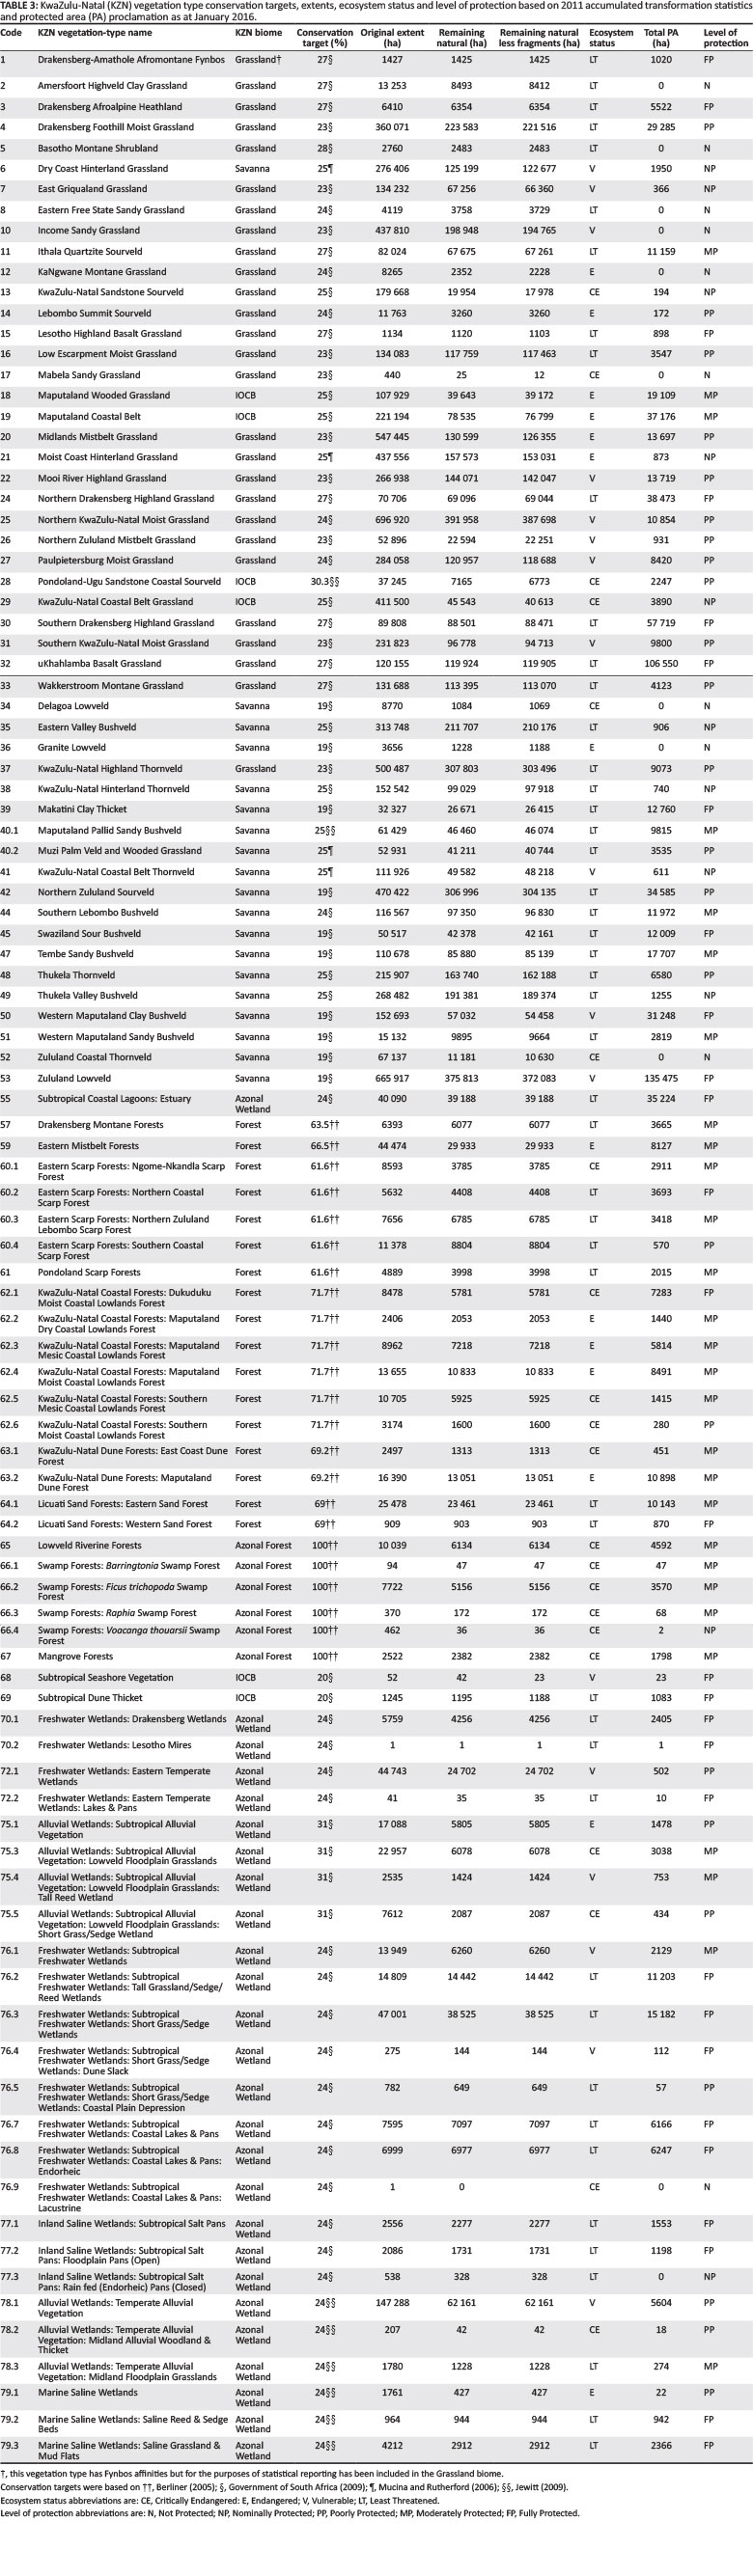
The degree of habitat loss varied across vegetation types and biomes, as did the conservation targets that ranged between 19% and 31.3% for non-forest targets and 61.6% and 100% for forest targets. The resulting conservation status of the vegetation types are: 21 (20.8%) vegetation types are Critically Endangered, 14 (13.9%) are Endangered, 17 (16.8%) are Vulnerable and 49 (48.5%) Least Threatened (Table 1, Figure 2c).
The IOCB had the least remaining natural vegetation (24.9%) as of 2011, followed by grasslands (50.3%), wetlands (58.7%), savannas (63.7%) and forests (73.9%) (Figure 1). Similarly, the average annual rates of habitat loss in the biomes between 1994 and 2011 were 2.9%, 1.7%, 1.3%, 1.3% and 0.9% in the IOCB, grasslands, wetlands, savannas and forests, respectively.
At a landscape scale, 9.1% of the terrestrial landscape is protected. The degree of protection (Figure 2d) within the biomes (Table 2) varies significantly, with only 6.8% of grasslands protected, 8.2% of the IOCB protected, 9% of the savannas protected, 24.6% of wetlands protected and 40.2% of forests protected.
Compared to the national listed threatened ecosystems, this analysis identifies additional vegetation types that are listed as Critically Endangered (e.g. Zululand Coastal Thornveld, Alluvial wetlands and Lowveld Riverine Forest) (Table 3). Similarly, a far greater proportion of vegetation types are listed as Vulnerable.
Discussion
We present the targets, remaining natural habitat, conservation and protection status of vegetation types and biomes in KZN. Only 46.2% of the province remains in a natural state once degraded areas are removed. This figure is conservative considering the extensive alien invasive plants that occur in KZN biomes (Van Wilgen et al. 2012). Currently, alien invasive plants are not detected and mapped on the land cover maps because of the scale and resolution at which the land covers are mapped. Further, it is not always possible to detect secondary vegetation, for example from abandoned agricultural fields, on satellite imagery. A further 7% of the landscape that is mapped as natural vegetation on the land cover maps is estimated to be historical agricultural fields (circa 1960/1970), which are depauperate in their species complement especially in terms of specialised species and geophytic plants (Jewitt et al. 2017). Hence, estimates of natural habitat remaining are conservative. It is therefore essential that high diversity, primary natural vegetation sites are identified and secured via Protected Area expansion and Stewardship programmes. These sites need to be appropriately managed to maintain their biodiversity value. High livestock stocking rates, unsustainable indigenous resource harvesting and alien invasive plant species are contributing to the degradation of intact ecosystems and are a major concern for the future.
The vegetation types occurring along the coast and the midlands have the largest loss of natural habitat and are thus the most threatened vegetation types in the province. The IOCB and grassland biomes have the least amount of natural habitat remaining and have the highest annual rates of habitat loss. They also have the least amount of formal protection. These vegetation types and biomes require urgent conservation action. To ensure representivity, each vegetation type should be adequately protected and have the target amount of habitat formally protected. The current distribution of the Protected Area network is biased. Future Protected Areas should be created in vegetation types without any protection or which are nominally or poorly protected. The Drakensberg, Zululand and Maputaland areas have a better Protected Area network than north-western and south-eastern KZN. Rates of habitat loss in the forest biome were the lowest but this may reflect the more recent mapping extent of forests rather than their actual habitat loss.
The indices reported here may help to inform land use planning and Protected Area expansion by spatially depicting vegetation types under greatest threat or requiring Protected Area expansion. These maps may be used in provincial conservation plans, spatial development frameworks, Protected Area expansion strategies and other land use planning initiatives. Whilst Protected Areas have increased in extent since 1994, the rate of habitat loss is continuing unsustainably, limiting the options to expand the Protected Area network and increasing the threat status of vegetation types. The rates of habitat loss have slowed over successive time periods, but this could be related to the sluggish economy (Jewitt et al. 2015b) or other factors and could potentially increase in future.
Jewitt et al. (2015b) identified the dominant drivers of transformation, or loss of natural habitat, as cultivated agriculture, timber plantations, the built environment, mining and dams. These represent the key sectors that should be engaged with to guide appropriate land use change. Rouget et al. (2003) recommend considering future land use changes to identify future threats and enable the search for alternative options. For instance, the Carbon Tax Policy, scheduled to come into effect in 2017, may have a significant effect on industries such as agriculture (Agri SA Commodity Chamber 2017). This could have the advantage of encouraging farmers to take up sustainable land management practices or it could drive significant land use changes in the agricultural landscape to remain economically viable.
South Africa has good environmental legislation (e.g. the Constitution of the Republic of South Africa and the National Environmental Management Act 107 of 1998) and is also a signatory to many different global conventions such as the Convention on Biological Diversity (CBD). These demand the conservation of landscapes, ecosystems and species for current and future generations. The intentions of the legislation and conventions are good, yet the loss of natural habitat and species declines continue, resulting in the high number of threatened ecosystems. A third of the vegetation types in the province are Endangered or Critically Endangered. The National List of Ecosystems that are Threatened and in need of protection (Act No. 1002 of 2011) was established to protect threatened ecosystems. This analysis demonstrates that several ecosystems have since attained a worse conservation status (based only on Criteria A1 or loss of habitat). This analysis identifies 8.5% of KZN as Critically Endangered compared to zero in the Threatened Ecosystem legislation. Similarly, 15.5% is listed as Endangered compared to 5% in the legislation. However, the legislation only became effective in 2011, meaning that future land cover maps will allow an assessment of the efficacy of the Threatened Ecosystem legislation. If current legislation, or perhaps the lack of implementation thereof, is not sufficient to protect ecosystems and species, a new model for conservation and sustainability must urgently be found. Indeed, the calls for acknowledging and implementing what is ultimately required to sustain life on the Earth are increasing (Noss et al. 2012). It is recognised that humanity is pushing ecosystems beyond their capacity to support life and time is running out to change the current failing trajectory (Ripple et al. 2017).
Targets
The targets used here may differ from national targets. Differences may arise because of the phytosociological data available at the time of the analysis, the differences between calculated targets and extrapolated targets and the finer scale of the provincial vegetation map compared to the national vegetation map. Similarly, the conservation status may differ because of revised vegetation boundaries at the time of the analysis, dates of land cover maps used and vegetation types that may extend beyond the boundary of KZN compared to KZN endemic vegetation types. Processes are in place to include finer scale mapping initiatives into the national vegetation map, facilitating a hierarchical level of mapping from broad scale to fine scale (Dayaram et al. 2017).
The targets provide an estimation of the area required to represent a single occurrence of 75% of the plant species occurring within the vegetation type (Desmet 2004). The targets do not consider ecological processes. Hence, the targets are conservative and will not ensure adequate representivity or persistence of all species, but they represent an important first step in securing representative habitats in the province. Recent conservation plans based on composite sets of biodiversity targets aimed at achieving biodiversity persistence require 60%-65% of the area (Noss et al. 1999). It is well known that larger areas conserve more species (Desmet & Cowling 2004) and are essential for ecological resilience. The probability of species extinctions is less in larger areas (Cumming 2011). Given climate change predictions, larger areas that are more resilient to environmental perturbations are critical. Noss et al. (2012) suggested that 50% of landscapes should be managed in a conservation-friendly manner so that species, populations and communities are conserved into the future. Similarly, Soulé and Sanjayan (1998) estimated that 50% of the landscape is required to maintain functional integrity and ensure biological persistence. Flather and Bevers (2002) found that there was a rapid decline in the probability of landscapes supporting viable populations once less than 50% of habitat remained. Plant pollination is significantly negatively impacted once 50% of the habitat is lost (Traveset et al. 2018). It is recommended that the current vegetation type targets, both provincial and national, should be revised to accommodate ecological and evolutionary processes, ensure essential ecosystem services are provided, maintain landscape connectivity and provide resilience to climate change impacts and other threats to maintain viable populations and ensure long-term persistence. It is recommended that the targets should be closer to 50% (Locke 2013) - significantly higher than the current targets.
KwaZulu-Natal has less than the recommended target amount of natural habitat remaining. As the province's ecological infrastructure is lost, an increasing proportion of species extinctions can be expected. The long-term social cost of losing this infrastructure is likely far greater than the short-term cost of preventing further loss of natural habitat in the landscape.
Conclusion
The evaluation of the conservation and protection status of vegetation types in KZN informs conservation priorities in the province. The rapid rate of habitat loss is creating an urgency to protect the remaining natural habitat, especially because the remaining primary, intact vegetation is below the recommended target of 50%. Restoration efforts are required in the Critically Endangered and Endangered vegetation types. Awareness campaigns are required amongst all stakeholders, highlighting the rapid loss of natural habitat and the legislative need to protect the environment. This would be enhanced by demonstrating the value and benefits of the natural environment to society. Agreements need to be secured amongst all government sectors to halt further conversion of primary habitat and rather intensify development on existing non-natural land. Business-as-usual is no longer an option if we are to meet the legislative requirements and mandates to conserve the environment for current and future generations.
Acknowledgements
The author wishes to thank Ed Witkowski for reviewing the draft manuscript and two anonymous reviewers and the editor for their comments that helped improve the manuscript.
Competing interests
The author declares that she has no financial or personal relationships that may have influenced her in writing this article.
References
Agri SA Commodity Chamber, 2017, 'Implications of a carbon tax and offset system for agriculture in South Africa', A presentation by Agri SA's Commodity Chamber to the Department of Environmental Affairs, The Department of Agriculture, Forestry and Fisheries and National Treasury, viewed 31 July 2017, from http://www.greenagri.org.za/blog/implications-of-a-carbon-tax-and-offset-system-for-agriculture-in-south-africa/ [ Links ]
Berliner, D., 2005, Systematic conservation planning for the forest biome of South Africa, Department of Water Affairs and Forestry, Pretoria, South Africa. [ Links ]
Cumming, G.S., 2011, 'Spatial resilience: Integrating landscape ecology, resilience, and sustainability', Landscape Ecology 26, 899-909. https://doi.org/10.1007/s10980-011-9623-1 [ Links ]
Dayaram, A., Powrie, L., Rebelo, T. & Skowno, A., 2017, 'Vegetation map of South Africa, Lesotho and Swaziland 2009 and 2012: A description of changes from 2006', Bothalia 47(1), a2223. https://doi.org/10.4102/abc.v47i1.2223 [ Links ]
Desmet, P., 2004, 'Appendix B - Developing species representation targets for South African vegetation types', in M. Rouget, B. Reyers, Z. Jonas, P. Desmet, A. Driver, K. Maze, et al. (eds.), South African National Spatial Biodiversity Assessment 2004 technical report Vol 1 terrestrial component, pp. 94-110, South African National Biodiversity Institute, Pretoria. [ Links ]
Desmet, P. & Cowling, R.M., 2004, 'Using the species-area relationship to set baseline targets for conservation', Ecology and Society 9(2), 11, viewed 28 January 2017, from http://www.ecologyandsociety.org/vol19/iss2/art11 [ Links ]
Doherty, M., Kearns, A., Barnett, G., Sarre, A., Hochuli, D., Gibb, H. et al., 2000, The interaction between habitat conditions, ecosystem processes and terrestrial biodiversity - A review, Australia: State of the Environment Second Technical Paper Series (Biodiversity), Series 2, Department of the Environment and Heritage, Canberra. [ Links ]
Driver, A., Sink, K.J., Nel, J.L., Holness, S., Van Niekerk, L., Daniels, F. et al., 2012, National biodiversity assessment 2011: An assessment of South Africa's biodiversity and ecosystems, Synthesis Report, South African National Biodiversity Institute and Department of Environmental Affairs, Pretoria. [ Links ]
Ezemvelo KZN Wildlife (EKZNW), 2010, KwaZulu-Natal provincial boundary. (kznbnd10_w31.zip), GIS coverage, Conservation Planning Division, Ezemvelo KZN Wildlife, Pietermaritzburg. [ Links ]
Ezemvelo KZN Wildlife (EKZNW), 2011a, KwaZulu-Natal provincial pre-transformation vegetation type map - 2011 (kznveg05v2_011_inhouse_w31.zip), GIS coverage, Conservation Planning Division, Ezemvelo KZN Wildlife, Pietermaritzburg. [ Links ]
Ezemvelo KZN Wildlife (EKZNW), 2011b, KwaZulu-Natal land cover 2005 v3.1, (clp_KZN_2005_LC_v3_1_grid_w31.zip), GIS coverage, Biodiversity Conservation Planning Division, Ezemvelo KZN Wildlife, Pietermaritzburg. [ Links ]
Ezemvelo KZN Wildlife (EKZNW), 2013a, KwaZulu-Natal land cover 2008 v2 (clp_KZN_2008_LC_v2_grid_w31.zip), GIS coverage, Biodiversity Research and Assessment, Ezemvelo KZN Wildlife, Pietermaritzburg. [ Links ]
Ezemvelo KZN Wildlife (EKZNW), 2013b, KwaZulu-Natal land cover 2011 v1 (clp_KZN_2011_LC_v1_grid_w31.zip), GIS coverage, Biodiversity Research and Assessment, Ezemvelo KZN Wildlife, Pietermaritzburg. [ Links ]
Ezemvelo KZN Wildlife (EKZNW), 2015, EKZNW Protected Area boundaries 2015 (Ekznw_pabnd_2015_wdd_new.zip), GIS coverage, Biodiversity Spatial Planning and Information, Ezemvelo KZN Wildlife, Pietermaritzburg. [ Links ]
Ezemvelo KZN Wildlife (EKZNW), 2016, EKZNW Stewardship boundaries 2016 (stewardship_wll_jan2016_draft.zip), GIS coverage, Biodiversity Spatial Planning and Information, Ezemvelo KZN Wildlife, Pietermaritzburg. [ Links ]
Ezemvelo KZN Wildlife (EKZNW) & GeoTerraImage (GTI), 2013, 2011 KZN Province land-cover mapping (from SPOT5 satellite imagery circa 2011): Data users report and metadata (version 1d), unpublished report, Ezemvelo KZN Wildlife, Pietermaritzburg. [ Links ]
Fairbanks, D.H.K., Thompson, M.W., Vink, D.E., Newby, T.S., Van den Berg, H.M. & Everard, D.A., 2000, 'The South African land-cover characteristics database: A synopsis of the landscape', South African Journal of Science 96, 69-82. [ Links ]
Flather, C.H. & Bevers, M., 2002, 'Patchy reaction-diffusion and population abundance: Relative importance of habitat amount and arrangement', The American Naturalist 159, 40-56. [ Links ]
GeoTerraImage (GTI), 2008, KZN Province land-cover mapping (from SPOT2/4 satellite imagery circa 2005-06): Data users report and metadata (version 2), Unpublished report, Ezemvelo KZN Wildlife, Pietermaritzburg. [ Links ]
GeoTerraImage (GTI), 2010, 2008 KZN Province land-cover mapping (from SPOT5 satellite imagery circa 2008): Data users report and metadata (version 1), unpublished report, Ezemvelo KZN Wildlife, Pietermaritzburg. [ Links ]
Giam, X., Bradshaw, C.J.A., Tan, H.T.W. & Sodhi, N.S., 2010, 'Future habitat loss and the conservation of plant biodiversity', Biological Conservation 143, 1594-1602. https://doi.org/10.1016/j.biocon.2010.04.019 [ Links ]
Government of South Africa, 2009, National Protected Area Expansion Strategy for South Africa 2008. Priorities for expanding the protected area network for ecological sustainability and climate change adaptation, Government of South Africa, Pretoria, South Africa. [ Links ]
Jetz, W., Wilcove, D.S. & Dobson, A.P., 2007, 'Projected impacts of climate and land-use change on the global biodiversity of birds', PLoS Biology 5, 1211-1219, https://doi.org/10.1371/journal.pbio.0050157 [ Links ]
Jewitt, D., 2009, Conservation targets for KZN vegetation types in KwaZulu-Natal, unpublished report, Biodiversity Division, Ezemvelo KZN Wildlife, Pietermaritzburg. [ Links ]
Jewitt, D., Erasmus, B.F.N., Goodman, P.S., O'Connor, T.G., Hargrove, W.W., Maddalena, D.M. et al., 2015a, 'Climate-induced change of environmentally defined floristic domains: A conservation based vulnerability framework', Applied Geography 63, 33-42. https://doi.org/10.1016/j.apgeog.2015.06.004 [ Links ]
Jewitt, D., Goodman, P.S., Erasmus, B.F.N., O'Connor, T.G. & Witkowski, E.T.F., 2015b, 'Systematic land-cover change in KwaZulu-Natal, South Africa: Implications for biodiversity', South African Journal of Science 111(9/10), Art. #2015-0019, 1-9. https://doi.org/10.17159/sajs.2015/20150019 [ Links ]
Jewitt, D., Goodman, P.S., Erasmus, B.F.N., O'Connor, T.G. & Witkowski, E.T.F., 2017, 'Planning for the maintenance of floristic diversity in the face of land cover and climate change', Environmental Management 59, 792-806. https://doi.org/10.1007/s00267-017-0829-0 [ Links ]
Locke, H., 2013, 'Nature needs half: A necessary and hopeful new agenda for Protected Areas', Parks 19, 9-18. https://doi.org/10.2305/IUCN.CH.2013.PARKS-19-2.HL.en [ Links ]
Lombard, A.T., Cowling, R.M., Pressey, R.L. & Rebelo, A.G., 2003, 'Effectiveness of land classes as surrogates for species in conservation planning for the Cape Floristic Region', Biological Conservation 112, 45-62. https://doi.org/10.1016/S0006-3207(02)00422-6 [ Links ]
Margules, C.R. & Pressey, R.L., 2000, 'Systematic conservation planning', Nature 405, 243-253. https://doi.org/10.1038/35012251 [ Links ]
Millenium Ecosystem Assessment (MEA), 2005, Ecosystems and human well-being: Biodiversity synthesis, World Resources Institute, Washington, DC. [ Links ]
Mucina, L., Hoare, D.B., Lötter, M.C., Du Preez, P.J., Rutherford, M.C., Scott-Shaw, C.R. et al., 2006a, 'Grassland biome', in L. Mucina & M.C. Rutherford (eds.), The vegetation of South Africa, Lesotho and Swaziland, pp. 348-437, SANBI, Pretoria. [ Links ]
Mucina, L. & Rutherford, M.C., 2006, The vegetation of South Africa, Lesotho and Swaziland, South African National Biodiversity Institute, Pretoria. [ Links ]
Mucina, L., Scott-Shaw, C.R., Rutherford, M.C., Camp, K.G.T., Matthews, W.S., Powrie, L.W. et al., 2006b, 'Indian Ocean coastal belt', in L. Mucina & M.C. Rutherford (eds.), The vegetation of South Africa, Lesotho and Swaziland, pp. 568-583, SANBI, Pretoria. [ Links ]
Noss, R.F., Dobson, A.P., Baldwin, R., Beier, P., Davis, C.R., Dellasala, D.A. et al., 2012, 'Bolder thinking for conservation', Conservation Biology 26, 1-4. https://doi.org/10.1111/j.1523-1739.2011.01738.x [ Links ]
Noss, R.F., Strittholt, J.R., Vance-Borland, K. & Frost, P., 1999, 'A conservation plan for the Klamath-Siskiyou ecoregion', Natural Areas Journal 19, 392-411. [ Links ]
Pressey, R.L., Cabeza, M., Watts, M.E., Cowling, R.M. & Wilson, K.A., 2007, 'Conservation planning in a changing world', Trends in Ecology and Evolution 22, 583-592. https://doi.org/10.1016/j.tree.2007.10.001 [ Links ]
Ripple, W.J., Wolf, C., Newsome, T.M., Galetti, M., Alamgir, M., Crist, E. et al., 2017, 'World scientists' warning to humanity: A second notice', BioScience 67, 1026-1028. https://doi.org/10.1093/biosci/bix125 [ Links ]
Rouget, M., Richardson, D.M., Cowling, R.M., Lloyd, J.W. & Lombard, A.T., 2003, 'Current patterns of habitat transformation and future threats to biodiversity in terrestrial ecosystems of the Cape Floristic Region, South Africa', Biological Conservation 112, 63-85. https://doi.org/10.1016/S0006-3207(02)00395-6 [ Links ]
Rutherford, M.C., Mucina, L. & Powrie, L.W., 2006, 'Biomes and bioregions of Southern Africa', in L. Mucina & M.C. Rutherford (eds.), The vegetation of South Africa, Lesotho and Swaziland, pp. 31-51, SANBI, Pretoria. [ Links ]
Schaffers, A.P., Raemakers, I.P., Sýkora, K.V. & Ter Braak, C.J.F., 2008, 'Arthropod assemblages are best predicted by plant species composition', Ecology 89, 782-794. https://doi.org/10.1890/07-0361.1 [ Links ]
Soulé, M.E. & Sanjayan, M.A., 1998, 'Conservation targets: Do they help?', Science 279, 2060-2061. https://doi.org/10.1126/science.279.5359.2060 [ Links ]
Traveset, A., Castro-Urgal, R., Rotlàn-Puig, X. & Lázaro, A., 2018, 'Effects of habitat loss on the plant-flower visitor network structure of a dune community', Oikos 127, 45-55. https://doi.org/10.1111/oik.04154 [ Links ]
Van den Berg, E.C., Plarre, C., Van den Berg, H.M. & Thompson, M.W., 2008, The South African national land-cover 2000, unpublished report, Report no. GW/A/2008/86, Agricultural Research Council - Institute for Soil, Climate and Water, Pretoria. [ Links ]
Van Wilgen, B.W., Forsyth, G.C., Le Maitre, D.C., Wannenburgh, A., Kotzé, J.D.F., Van den Berg, E. et al., 2012, 'An assessment of the effectiveness of a large, national scale invasive alien plant control strategy in South Africa', Biological Conservation 148, 28-38. https://doi.org/10.1016/j.biocon.2011.12.035 [ Links ]
Vitousek, P.M., 1994, 'Beyond global warming: Ecology and global change', Ecology 75, 1861-1876, https://doi.org/10.2307/1941591 [ Links ]
Walters, D.J.J., Kotze, D.C. & O'Connor, T.G., 2006, 'Impact of land use on vegetation composition, diversity, and selected soil properties of wetlands in the southern Drakensberg mountains, South Africa', Wetlands Ecology and Management 14, 329-348. https://doi.org/10.1007/s11273-005-4990-5 [ Links ]
 Correspondence:
Debbie Jewitt
debbie.jewitt@kznwildlife.com
Received: 21 Aug. 2017
Accepted: 03 Mar. 2018
Published: 09 May 2018

