


Servicios Personalizados
Articulo
 Inglés (pdf)
 Articulo en XML
 Referencias del artículo
Indicadores

Links relacionados
-
 Citado por Google
 -
 Similares en Google
Compartir

 Permalink
Bothalia - African Biodiversity & Conservation
versión On-line ISSN 2311-9284
versión impresa ISSN 0006-8241
Bothalia (Online) vol.47 no.1 Pretoria 2017
http://dx.doi.org/10.4102/abc.v47i1.2182
ORIGINAL RESEARCH
The Gauteng Conservation Plan: Planning for biodiversity in a rapidly urbanising province
Michèle F. PfabI, II; Petronella C. CompaanII; Craig A. Whittington-JonesII; Ian EngelbrechtII, III; Lihle DumalisileII; Lorraine MillsII; Sean D. WestII; Piet J. MullerII; Gavin P.R. MastersonII, IV; Livhuwani S. NevhutaluII, V; Stephen D. HolnessVI; David B. HoareVII
ISouth African National Biodiversity Institute, Pretoria, South Africa
IIGauteng Department of Agriculture and Rural Development, Johannesburg, South Africa
IIIDepartment of Zoology and Entomology, University of Pretoria, South Africa
IVSchool of Animal, Plant and Environmental Sciences, University of the Witwatersrand, South Africa
VCity of Johannesburg Metropolitan Municipality, Braamfontein, South Africa
VICentre for African Conservation Ecology, Department of Zoology, Nelson Mandela Metropolitan University, South Africa
VIIDavid Hoare Consulting cc, Vanderbijlpark, South Africa
ABSTRACT
BACKGROUND: Gauteng, the smallest of South Africa's nine provinces, is rich in biodiversity; yet it is also the most densely populated province and thus faces significant development pressures.
OBJECTIVE: A project was therefore initiated in 2001 to identify areas of biodiversity importance in the province, using the systematic spatial biodiversity planning approach that has been adopted in South Africa. This article reports on the final version of the provincial conservation plan as completed in 2011.
METHOD: Vegetation types and quaternary catchments constituted the coarse filter biodiversity features, while rare and threatened taxa constituted the fine filter features. Ecological processes were captured by a range of landscape features, while planning for climate change primarily involved the design of a corridor network. Planning was undertaken within the ArcView linked C-plan decision support system, where a cost surface preferentially directed the selection of available sites towards low-cost areas.
RESULTS: Forty-four per cent of the province is required to achieve targets. Only 8% of features are close to having their targets met or are adequately conserved in the current protected area network of 23 protected areas covering 2.4% of the province, while 73% of features are absent or poorly represented.
CONCLUSION: The existing protected area network is inadequate for the conservation of biodiversity in Gauteng. The Gauteng Conservation Plan identifies a set of areas that are required to achieve conservation targets. It is important that identified areas currently not in the protected area network are protected either formally or through legislated land use management processes.
Introduction
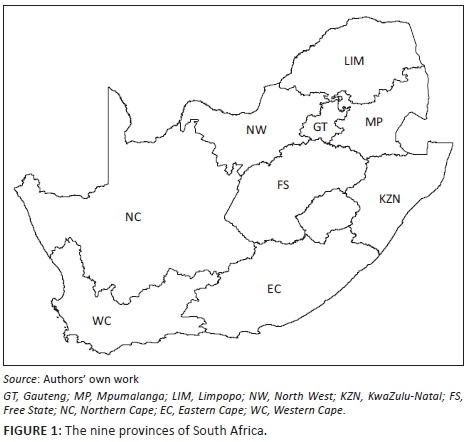
Gauteng is the smallest of South Africa's nine provinces (Figure 1) and is generally regarded as the economic powerhouse of South Africa. It is the most densely populated province in the country with the highest population growth rate and the demand for urban land in this rapidly urbanising province is therefore high. The mining sector also has a significant presence in Gauteng, with the city of Johannesburg established over 100 years ago after the discovery of gold on the Witwatersrand. A sustainable and healthy urban environment is dependent on biodiversity providing ecosystem services such as air filtration, groundwater recharge, flood attenuation, water purification, pollination services, pest control, medicinal species and thatching grass (Davidson 2000; Folke 2006; Robinson 2006). Biodiversity has also been shown to be important for human emotional, mental and physical well-being (Balmford & Bond 2005; Miller 2005).
Despite its small size (approximately 18 178 km2), Gauteng is rich in biodiversity. The province is situated within both the savanna and grassland biomes, with approximately 80% of its area designated as Highveld Grassland, one of the two richest primary grasslands in the world, that is also particularly poorly conserved (< 2% protected) (Low & Rebelo 1996; Mucina & Rutherford 2006). An estimated 2183 plant taxa (SANBI 2013), 125 mammal species (Low & Rebelo 1996), 488 bird species (South African Bird Atlas Project 2), 21 amphibian species (Whittington-Jones et al. 2009) and 92 reptile species (Whittington-Jones et al. 2008) occur in Gauteng. At least 11 taxa are endemic to the province.
In the first National Spatial Biodiversity Assessment published for South Africa in 2004 (Driver et al. 2004), Gauteng was shown to be situated wholly within two of nine national biodiversity priority areas, the so-called Bushveld-Bankenveld and Wet Grasslands. Most of the land area of the province is also situated within a crisis ecoregion classified as Critically Endangered (Hoekstra et al. 2005), indicating that the biodiversity and ecosystem services in Gauteng are at greatest risk when measured at a global scale.
In 2001, the former Gauteng Directorate of Nature Conservation (of the then Gauteng Department of Agriculture, Conservation and Environment and now the Biodiversity Management Component of the Department of Agriculture and Rural Development [GDARD]) embarked on a biodiversity planning project for the province that finally culminated in the completion of the Gauteng Conservation Plan Version 3.3 in 2011. The project aimed to identify and map areas important to biodiversity in Gauteng through a spatial biodiversity planning exercise underpinned by explicit representation and persistence goals, and to ultimately provide recommendations and policy strategies for the conservation and management of these areas. It involved the collection and repeated analysis of biodiversity data. The analysis was based on the systematic conservation planning protocol developed by Margules and Pressey (2000) as adapted further by the collective efforts of the South African conservation planning community, which has produced a number of provincial conservation plans, most notably for Mpumalanga and KwaZulu-Natal. The protocol involves selecting features to be used as surrogates for overall biodiversity, setting explicit goals and translating them into quantitative operational targets, determining the extent to which these conservation targets are met in existing protected areas and identifying additional areas to complement existing protected areas in achieving targets not met. The underlying principles of this protocol include complementarity (avoidance of duplication of important attributes), efficiency (most protection for the least cost/area), defensibility (justification of decisions made), flexibility (in the face of competing land uses), persistence (capturing of ecological processes and exclusion of threats for long term viability in a dynamic environment) and accountability (in allowing decisions to be critically reviewed).
This article reports on the final version of the provincial conservation plan that was completed in 2011, produced using a statistical approach through the calculation of irreplaceability in the C-plan decision support system (Pressey et al. 2009), together with a multi-criterion approach through the post hoc inclusion of landscape features as surrogates for ecological processes.
Methods
Biodiversity is defined as the variety and variability among living organisms and the ecological complexes in which they occur (Scott et al. 1995). As the concept encompasses landscapes, communities, species, populations, individual organisms and genes, as well as ecological processes, biodiversity surrogates representing these different levels of biological organisation were fundamental to the biodiversity planning exercise for Gauteng. An integrative hierarchical approach (Pfab 2002) was adopted, in which the coarse filter for terrestrial and aquatic species, respectively, constituted a vegetation spatial layer (map) (Figure 2h), and maps of quaternary catchments and endorheic pans and pan clusters (Allan, Seaman & Kaletja 1995) (Figure 2i). Plant communities are regarded as useful surrogates for biodiversity as they are thought to provide a reliable representation of faunal and floral species diversity (Lesica 1993), especially organisms that are poorly known and difficult to survey such as soil microfauna, bacteria and fungi that carry out critical ecosystem functions such as decomposition and nitrogen fixation (Franklin 1993; Noss 1996). It is estimated that a coarse filter for biodiversity captures 85%-90% of species (Noss 1987), predominantly the common and widespread species. Spatial layers (maps) of rare and threatened plant, bird, invertebrate, mammal, fish and reptile taxa constituted the fine filter (Figure 2a-f; Table 1).
Coarse filter biodiversity surrogates mapping and target setting
A provincial vegetation map comprising 12 vegetation types (Figure 2h) was developed from an analysis of plant species composition data (including all grass, woody and herbaceous species) collected during summer season sampling of 100 m2 plots at 439 randomly stratified sample sites across the province using the Braun-Blanquet method. Sample stratification of 900 original plots took into account existing vegetation types (Mucina & Rutherford 2006), 127 unique environmental classes (obtained after intersecting temperature, rainfall and altitude spatial layers in a geographic information system [GIS]) and 30 putative vegetation classes (delineated through an unsupervised classification of December 2001/January 2002 LANDSAT 7 satellite imagery filtered to remove all non-natural land cover). Following field surveys, 461 plots were discarded because they were situated within secondary vegetation (having previously been ploughed for agriculture) or were found to be irreversibly modified.
Within the vegetation types, only primary vegetation (Figure 2g) was included in the biodiversity planning exercise. All secondary vegetation in the province was delineated from crop lands shown in old topocadastral maps and agricultural lands mapped in available land cover data sets. Altogether, only 40% of the vegetation in the province remains in a primary state (Table 2). Gauteng Grassland, by far the largest vegetation type in the province, is in a particularly poor state with only 28% primary vegetation remaining (Table 2).
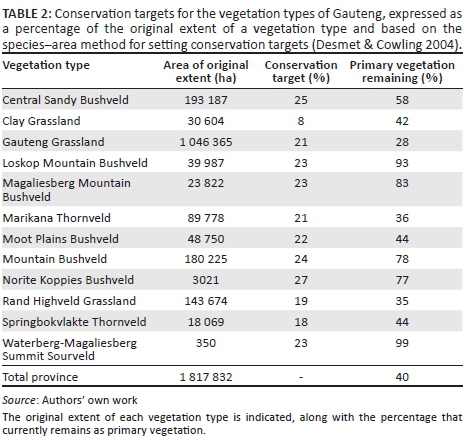
The minimum percentage area required to represent all species within a region is highly variable and depends on the diversity and endemism of the taxa of concern (Rodrigues & Gaston 2001). The method developed by Desmet and Cowling (2004) that is based on the species-area relationship was therefore used to calculate conservation targets for the 12 vegetation types, expressed as the percentage of the original extent of the vegetation type required to represent 80% of the associated species. Ranging between 8% for Clay Grassland and 27% for Norite Koppies Bushveld (Table 2), these conservation targets compare favourably with those recommended in the conservation literature, which range between 12% and 75% (Cowling & Heijnis 2001).
A total of four quaternary catchments that were deemed to be in a good condition, that is, where the rivers retain a high proportion of their natural or remnant ecological organisation and functions as indicated by River Health PESC scores (Kleynhans & Louw 2008) of C or higher, were selected as surrogates for aquatic species (Figure 2i). As these four quaternary catchments are together representative of the Eastern Bankenveld and Bushveld, Western Bankenveld and Highveld Level II Ecoregions used as a basis for the River Health Programme (Kleynhans & Louw 2008) (Table 3), representation goals were fulfilled. A land cover analysis of upstream or source quaternary catchments indicated that rivers in a B or C ecological state were associated with a minimum vegetation cover (inclusive of both primary and secondary vegetation) of 59% and 46%, respectively. These results informed the conservation targets for the four quaternary catchments (Table 3); the targets aimed at retaining the associated rivers in good ecological states.
Clusters of endorheic pans within the good condition quaternary catchments were mapped as a separate feature (Figure 2i) with a 100% conservation target. These were identified in a GIS by buffering each pan with 1 km (based on the dispersal distance of giant bullfrogs (Yetman & Ferguson 2011)). In addition to this, good-quality pans (endorheic pans with < 40% urban development within the pan catchment), buffered with a distance of 1 km to represent the pan catchment, were identified in other areas of the province, 20 in all, and mapped as an additional feature with a 100% conservation target (Figure 2i). These endorheic pans support a diversity of amphibians as well as diverse and abundant populations of birds (Whittington-Jones 2007).
Fine filter biodiversity surrogates mapping and target setting
Ongoing and extensive biodiversity surveys were initiated for Gauteng in 2001 to generate data on the spatial occurrence of plant and animal species. Prior to this, up-to-date information on the biodiversity of the province was severely lacking. The data that existed were associated with sampling bias, were outdated or were captured at too coarse a scale (e.g. quarter degree grids). Surveys for fauna involved passive trapping (using a variety of baited and non-baited traps, cages, nets, etc.), active supplementary searches of suitable habitat and incidental observations. Species occurrence data generated by these surveys were augmented with data sourced from the literature, herbaria, museums, biodiversity databases (e.g. the Coordinated Avifaunal Roadcount [CAR], the Coordinated Waterbird Count [CWAC], the Birds in Reserves Project [BIRP] and the Southern African Butterfly Conservation Assessment [SABCA]), experts and citizen scientists. Confirmed observations of the faunal taxa selected as biodiversity surrogates (Table 1) were used to map confirmed habitat (Figure 2c-f) following the approach in Pfab and Witkowski (1997) (for detailed GIS methods, see Compaan 2011), while suitable habitat was mapped for historical occurrences.
Targeted searches were carried out for the Threatened (Pfab & Victor 2002) and Orange List (Victor & Keith 2004) plant species. The sizes of the located populations were estimated and the area of occupancies mapped using a GPS device. Located populations were buffered in a GIS with distances between 200 m and 600 m to mitigate against deleterious edge effects, ranging from those present within the first 200 m such as microclimate changes (Laurance et al. 2002), trampling and resource use (Shafer 1999) and dry pollutants (Burger, Coetzee & Enslin 2000; Conservation Biology Institute 2000; Shafer 1999; Watkins et al. 2003) to those present up to 600 m such as edge fauna (Carvalho & Vasconcelos 1999; Laurance et al. 2002), air pollutants (Burger et al. 2000; CBI 2000; Shafer 1999; Watkins et al. 2003), invasive plants (CBI 2000; Laurance et al. 2002) and Argentine ants (CBI 2000; Holway 2004). Patches of suitable habitat were modelled in a GIS for plant populations that could not be located but presumed extant (Compaan 2011; Pfab & Witkowski 1997). Suitable habitat models were either based on habitat descriptions in the literature or on values of environmental parameters measured in a GIS at the exact co-ordinates of known populations, or a combination of both.
Conservation targets for species followed the approach developed by Pfab, Victor and Armstrong (2011) (Table 1; for full rationales, see Compaan 2011), where species targets were based on the quantitative thresholds developed for the Vulnerable category of the International Union for Conservation of Nature (IUCN) Red List system to avoid species qualifying for a Threatened listing in the future. This translates to a target of 11 locations/populations/localities and 10 000 mature individuals. For species already in a Threatened category, targets aimed to prevent a deterioration of their extinction risk, requiring the conservation of all known populations of Critically Endangered, Endangered and Vulnerable species listed under the IUCN Red List criteria of B, C or D, or the conservation of 11 locations/populations/localities and 10 000 mature individuals for all Threatened species solely listed under the IUCN Red List criteria A or E (Table 1). Targets were first set at a national level and then subsequently proportionally assigned to Gauteng.
Mapping ecological processes
In this biodiversity planning exercise, landscape features (also termed mesofilters (Hunter 2005)) such as perennial and non-perennial rivers, wetlands, clusters of endorheic pans, ridges and dolomite were mapped as surrogates for ecological processes and used to direct the selection of areas into the conservation plan (see data analysis). All known cave roosting sites for the bat species included in the fine filter (Table 1) were considered to be a surrogate for the province's unique cave ecosystem and associated processes. Rivers (Figure 3b) and wetlands (Figure 3c) are important for groundwater dynamics, hydrological processes, nutrient cycling and wildlife dispersal. The quartzite ridges (Figure 3e) of the province are also important for wildlife dispersal as they form naturally existing corridors that functionally interconnect isolated natural areas. They can also be regarded as a surrogate for evolutionary processes as the interaction between topography and climate promotes the evolution of new species (Bredenkamp & Brown 2003; Wilsey, Martin & Polley 2005). Ridges are important for regulating hydrological processes as many streams originate on ridges and they control water inputs into wetlands. They are important for pollination as well because they provide habitat for pollinators, and honeybee drone congregation areas are normally close to hills and ridges. Large areas of the province (15%) underlain by dolomite (or karst) (Figure 3a) are considered to be important for the regulation of hydrological processes (such as groundwater storage, purification, discharge and recharge) and nutrient cycling.
Planning for climate change
To be resilient against climate change, a landscape that allows species to respond to temperature changes and increased weather perturbations and to adapt genetically to changing environments (Opdam & Wascher 2004) is required. Increasing the connectivity and permeability of the landscape to allow for dispersal (Donald & Evans 2006; Midgely et al. 2003; Root & Schneider 2006; Williams et al. 2005) is crucial. A corridor network (Figure 3d) was therefore designed for Gauteng, which included two east-west corridors to allow for species movement in response to rainfall gradients and two north-south corridors to allow for species movement in response to temperature gradients. GIS analyses mapped least cost pathways over the landscape (Compaan 2011) using frictional surfaces that favoured natural vegetation (preferentially those areas identified in the previous Gauteng Conservation Plan Version 2.1). To cater for a variety of terrestrial and aquatic-dependent species, the least cost analysis for each corridor was repeated twice: first to favour ridges and then to favour rivers and wetlands. Least cost GIS analyses (again targeting ridges as well as wetlands and rivers) were also conducted to create a network of species corridors to facilitate species movement between protected areas and other priority biodiversity areas identified in previous versions of the Gauteng Conservation Plan. A standard width of 600 m was applied to all identified corridors in order to include sufficient core habitat for indigenous species (Hilty & Merenlender 2004), edge effects being predominantly present within 200 m of an edge (Burger et al. 2000; CBI 2000; Laurance et al. 2002; Shafer 1999; Watkins et al. 2003; Zeng, Sui & Wu 2005).
Movement of species considered to be fair to good dispersers (Cousins, Lavorel & Davies 2003) in response to climate change is hampered in a fragmented landscape. Unoccupied suitable habitat patches, sufficiently well connected to allow for gene flow between populations (e.g. through pollen and propagule dispersal) (Jump & Peñuelas 2005), are vital for metapopulation persistence. Suitable habitat patches were therefore mapped within the extent of occurrence (IUCN 2001) of those plant taxa considered to be fair dispersers (Figure 2b). Eighteen taxa were classified as fair dispersers (Table 1) based on their life histories (annuals are more likely to be fair dispersers), abundance in the landscape (species with few individuals scattered throughout the landscape are more likely to be fair dispersers) and dispersal syndromes (seeds dispersed through ingestion or adhesion, small-seeded species or wind-dispersed species are more likely to be fair dispersers). On the assumption that extant populations are at 37% equilibrium occupancy (Lopez & Pfister 2001), a conservation target was set for unoccupied patches of suitable habitat in a ratio of 1.7 unoccupied patches to every occupied patch. Conservation targets for butterflies included 70% modelled suitable habitat to allow for the large number of habitat patches required for metapopulation persistence (Bulman et al. 2007; Kuussaari et al. 2009; Schtickzelle et al. 2005) and 30% unsuitable habitat to promote connectivity between patches of suitable habitat (Fischer & Lindenmayer 2007).
As biases in environmental representation can exacerbate the impacts of climate change and habitat loss (Pyke 2004; Pyke & Fischer 2005), the Gauteng Conservation Plan was designed to maximise bioclimatic representation, that is, the diversity of regional environmental conditions was proportionally represented as far as possible. By maximising habitat or environmental heterogeneity in the landscape, genetic diversity to allow for adaptation can also be maximised (Graudal, Kjær & Canger 1995), while the persistence of metapopulations can be facilitated by preserving a range of micro-climates (Gillson & Willis 2004). Altogether 978 unique bioclimatic classes were identified for the province by combining altitude, slope, aspect and geology spatial layers in a GIS and then removing all non-natural areas (Compaan 2011). Areas in the province where 905 of these unique classes were represented most efficiently (excluding areas isolated within the urban environment) were identified through a separate analysis undertaken using Marxan, a conservation planning software developed at the University of Queensland (Ball, Possingham & Watts 2009). The feature produced by this exercise covered only 4.3% (78 167 ha) of the province (Figure 2j) and was found to overlap to a fair degree with other biodiversity features as well as with the province's ridges; therefore, a high conservation target of 90% was set.
Carbon sequestration is considered to be important for mitigating anticipated climate warming (Thomas et al. 2004) and can be promoted by, for example, conserving forests and protecting dolomite or karst (an important carbon sink) (the latter already mapped as an ecological process). As there are no real forests in Gauteng, densely wooded areas occurring on steep slopes and in steep ravines (named Dinokeng Scarp Woodland, Magaliesberg Scarp Woodland, Suikerbosrand Mesic Woodland and Wilge Scarp Woodland) were included as features (Figure 2i) in the biodiversity planning exercise with 100% conservation targets. These areas also represent an extremely rare plant community type in Gauteng, potentially with species that are rare in the province or at the limits of their distribution. By conserving marginal populations, genetic diversity is maximised and this is considered advantageous for adaptation to climate change (Hampe & Petit 2005).
The inclusion of all wetlands into the conservation plan as an ecological process is anticipated to mitigate the predicted increase in rainfall intensity and extreme flood events.
Data analysis and building the conservation plan
Data analysis was undertaken within the ArcView linked C-plan decision support system developed by the New South Wales National Parks and Wildlife Services in Australia (Pressey et al. 2009). In 2008, the continued use of C-plan for the project was carefully considered as other conservation practitioners started switching to Marxan (Ball et al. 2009). A sensitivity analysis conducted for a subset of the Gauteng data showed the C-plan and Marxan solutions to be very similar, unless compactness was included as a design objective in the Marxan analysis of which a less efficient solution that failed to achieve all conservation targets was the result, an understandable outcome considering the fragmented nature of this urbanising province. The objective of the provincial conservation plan was not to design a compact reserve network, and C-plan was considered to be a more useful tool for local-scale implementation of land use planning, such as through the Environmental Impact Assessment (EIA) process. C-plan's summed irreplaceability function was found to be particularly useful. Zonation (Moilanen et al. 2014), an alternative conservation planning tool, was not assessed.
C-Plan calculates and displays the irreplaceability of each of the sites in a planning region as a guide to their importance for achieving the regional conservation targets. Irreplaceability is defined as the likelihood that a given site will need to be protected to achieve conservation targets. High irreplaceability sites have few or no options for achieving targets and are absolutely necessary if targets are to be achieved. Low irreplaceability values indicate sites with a high degree of flexibility with respect to achieving targets and there are options as to which sites are included in the plan.
The C-plan analysis used a 100 ha hexagonal planning unit to maximise connectivity between adjacent sites. Sites were a priori classified as available or excluded, or as an existing protected area. The following land cover classes were excluded from the analysis: degraded land, non-vegetated/bare land, plantations and woodlots, urban trees, intensive cattle camps, urban areas, mines, sports and recreation grasslands, degraded land associated with smallholdings and non-vegetated/bare/degraded lands associated with old agricultural fields. All protected areas in the province were ground-truthed to confirm their legislative, management and ecological statuses. Only those ecologically intact areas proclaimed in terms of relevant legislation (specifically for the protection of biodiversity or for the purposes of nature conservation) and subject to management plans with a biodiversity focus, as well as those areas either formally proclaimed or subject to management plans, were considered to be part of the protected area network and designated level 1 (a total of 3) and level 2 (a total of 20) protected areas, respectively (Figure 2k).
The first step in building the conservation plan involved the selection of all irreplaceable available sites. A cost surface (Figure 2l) was created to direct the selection of available sites required to meet the remaining conservation targets. Low-cost areas with cost values of 1 included level 3 protected areas, that is, ecologically intact protected areas that are neither formally proclaimed (for the purposes of biodiversity conservation) nor have management plans (with a biodiversity focus), conservancies and low-cost metropolitan areas (areas to a greater or lesser extent under some level of development restriction through local land use planning instruments) (Figure 3f). (In Gauteng, a conservancy is a voluntary association that consists of land users or landowners who cooperatively manage their natural resources in an environmentally friendly manner without necessarily changing the land use of their properties.) Other low-cost areas included the corridor network with a cost value of 2 (Figure 3d) and ecological process landscape features (i.e. dolomite [Figure 3a], perennial rivers [Figure 3b], wetlands and pans [Figure 3c] and ridges [Figure 3e]), all with a cost value of 3. Through the preferential selection of available sites situated within low-cost areas, high-cost areas, such as land important for agriculture (cost value 4), mining (cost value 5) and urban development (cost value 6), were avoided.
Sites required to meet the remaining conservation targets subsequent to the selection of irreplaceable sites were added into the conservation plan using an iterative process. The available sites with the highest biodiversity values (top 5% as indicated by the summed irreplaceability value calculated by the C-plan software) were identified and those located within the lowest cost areas (Figure 2l) were then selected into the conservation plan. By recalculating the summed irreplaceability values of the remaining available sites, this process was iteratively repeated until eventually no further high-value biodiversity sites were available in low-cost areas (cost values 1-3). To meet remaining conservation targets, available sites with the highest irreplaceability values were iteratively selected into the conservation plan, with the larger sites preferentially selected in the event of a tie. A comparison of this approach with a simple Minset algorithm involving the iterative selection of the sites with the highest biodiversity values without consideration of the cost values yielded a result that was no more efficient (41.0% vs. 40.9% of the province). The efficiency of the final output was further enhanced (yielding a result of 31.8% of the province) by clipping all sites selected into the conservation plan to the underlying biodiversity features, thereby removing any extraneous land not required to meet conservation targets, and finally removing isolated fragments of land of less than 5 ha.
The final conservation plan consisted of levels 1 and 2 protected areas, irreplaceable areas and important areas, the latter being those areas required to meet the conservation targets not already achieved in the protected and irreplaceable areas. Through examining contributions to target achievement, the final plan enabled an assessment of the importance of each protected area for biodiversity conservation and the adequacy of the provincial protected area network.
To align the conservation plan with the provisions for bioregional plans in the National Environmental Management: Biodiversity Act No. 10 of 2004 (NEMBA), protected, irreplaceable and important areas were together classified as Critical Biodiversity Areas (CBAs), while all landscape features mapped as surrogates for ecological processes that were not already contained within a CBA were added to the plan and designated Ecological Support Areas (ESAs). These landscape features included wetlands and pans (Figure 3c), perennial rivers (Figure 3b), non-perennial rivers (with 20 m buffers), ridges (Figure 3e) situated within 1500 m (based on the typical foraging distance of honey bees (Chacoff & Aizen 2006)) of CBAs and dolomite (Figure 3a). Corridors (Figure 3d) and low-cost metropolitan areas (Figure 3f) were also added as ESAs if they were not already situated within a CBA. In a final clean-up of the plan, agricultural areas within CBAs were reclassified into ESAs and newly irreversibly modified areas were removed.
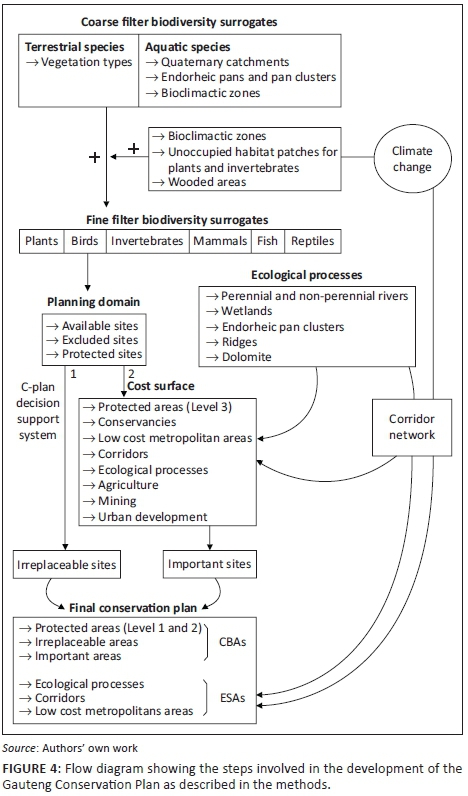
All steps in the development of the Gauteng Conservation Plan are depicted in Figure 4.
Results
Altogether the conservation plan identified 44% of the land surface area of the province and met all conservation targets efficiently. Critical biodiversity areas (i.e. areas that must be maintained in a good ecological condition (natural or near-natural state) in order to meet conservation targets), including irreplaceable (7.1% of the province), important (16.4% of the province) and protected (2.4% of the province) areas, comprised 26% of the province in the final conservation plan, while an additional 18% of the province constituted ESAs (Figure 5). Irreplaceable areas are crucial to achieving conservation targets and, if lost, targets cannot be achieved.
Of the 121 features included in the biodiversity planning exercise, 48 (40%) do not occur within any protected area (Table 4; Figure 6). Another 40 features (33%) are poorly represented in existing protected areas, the protected area network providing for less than 20% of each of the conservation targets set for these features (Table 4; Figure 6). The plant species Alepidea attenuata, Aloe peglerae, Blepharis uniflora, Cleome conrathii, Delosperma gautengense, Delosperma macellum, Delosperma purpureum, Frithia pulchra, Gladiolus pole-evansii, Gladiolus robertsoniae, Khadia beswickii, Nerine gracilis and Prunus africana, the Blue Korhaan (Eupodotis caerulescens), the butterfly Lepidochrysops praeterita and the bats Miniopterus schreibersii, Myotis tricolor, Rhinolophus blasii, Rhinolophus clivosus, Rhinolophus darlingi and Rhinolophus hildebrandtii are not conserved at all within Gauteng's protected area system (Table 4), and are therefore particularly vulnerable to activities leading to habitat loss. The Cape Vulture (Gyps coprotheres) breeding colony in the Magaliesberg is also not protected (Table 4), although these birds forage widely in the province, and individuals and groups have been recorded erratically in some protected areas. The Clay Grassland, Springbokvlakte Thornveld and Waterberg-Magaliesberg Summit Sourveld vegetation types are not represented in any protected area, while the occurrence of Moot Plains Bushveld in protected areas is negligible (Table 4). Other features not represented within any protected areas include Dinokeng Scarp Woodland and the Maloney's Eye sub-catchment (required for the conservation of the mountain catfish, the lowveld large-scale yellowfish and the bushveld small-scale yellowfish). Of concern for the biodiversity that is dependent on aquatic systems, no level 1 or 2 protected areas occur within two out of the four good condition quaternary catchments (Skeerpoort and Upper Suikerbosrant), while neither pan clusters within good condition quaternary catchments nor good-quality pans (endorheic pans with < 40% urban development within the pan catchment) occur within any protected areas (Table 4).
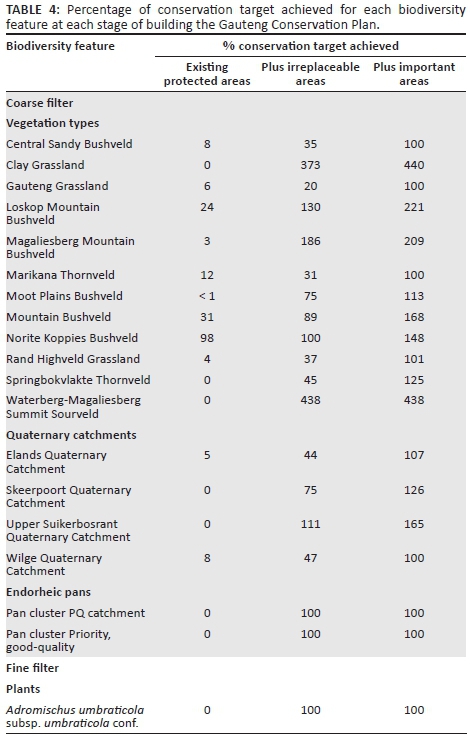
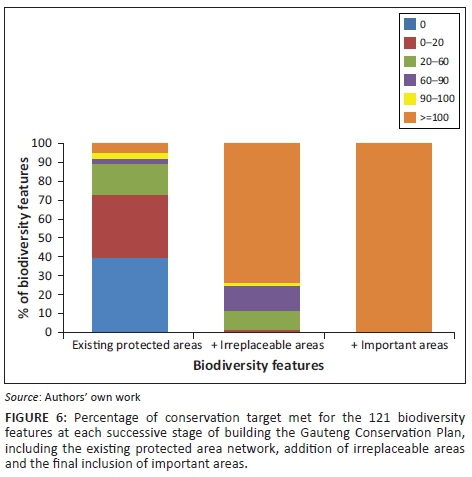
The addition of irreplaceable areas in the first step of creating the conservation plan resulted in an almost 10-fold increase in the representation of the province's biodiversity, such that approximately 76% of the included features would be afforded adequate protection (Table 4; Figure 6) in the event that converting land uses were excluded from these areas. Still inadequately protected at this stage in the conservation plan development were the Central Sandy Bushveld, Gauteng Grassland, Marikana Thornveld, Rand Highveld Grassland and the Springbokvlakte Thornveld vegetation types, as well as the Elands and Wilge quaternary catchments and the bioclimatic classes mapped for climate change adaptation (Table 4). With the exception of Springbokvlakte Thornveld, these features all require large areas (>18 000 ha) for meeting conservation targets. Similarly, the breeding area for the Blue Crane (Anthropoides paradiseus) and habitat for the butterfly Lepidochrysops praeterita still required additional area for meeting conservation targets (Table 4). In the final stage of the conservation plan development, all conservation targets were met with the addition of important areas (Table 4; Figure 6).
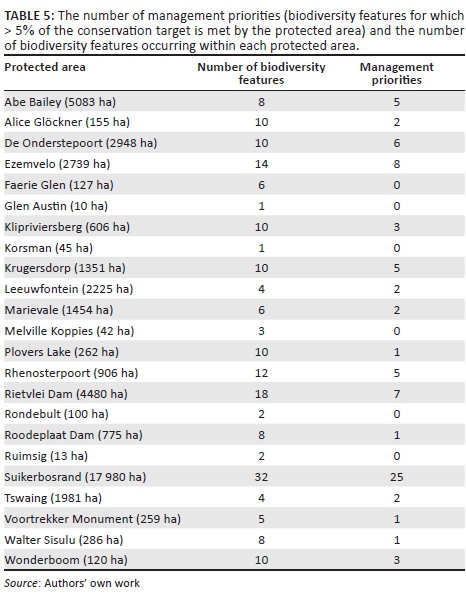
Of all the protected areas in the province, the Suikerbosrand Nature Reserve (17 980 ha) and the Rietvlei Dam Nature Reserve (4480 ha) contribute towards meeting conservation targets for the most biodiversity features (32 and 18 biodiversity features, respectively) (Table 5). In addition to contributing to the conservation of confirmed populations of three Threatened and two Near Threatened plant species, four Red Listed bird species and two Red Listed butterfly species, Suikerbosrand Nature Reserve contributes significantly towards the conservation of Mountain Bushveld (meeting 27% of the conservation target for this vegetation type) and is also important for climate change adaptation. The De Onderstepoort, Ezemvelo, Krugersdorp and Rhenosterpoort nature reserves are also noteworthy, with 10 or more biodiversity features and five or more clear management priorities (Table 5).
Discussion
The Gauteng Conservation Plan is a crucial tool for the implementation in Gauteng of the national biodiversity mandate contained within the provisions of NEMBA. The plan identifies areas that are required for the conservation of a representative and sustainable sample of the province's biodiversity, where converting land uses should be excluded, where land uses incompatible with biodiversity should be avoided and where special management measures are required to maintain and protect biodiversity. Altogether 26% of Gauteng is required for the conservation of the province's biodiversity, while an additional 18% of the province is important for the continued functioning of the ecological and evolutionary processes that maintain and generate biodiversity - in all 44% of the land surface area. This is well above the oft-posited arbitrary representation targets of 10% or 12%, which may provide effective protection for only half of all terrestrial species (Soulé & Sanjayan 1998), but lower than the 52% required for biodiversity conservation in the Cape Floristic region (Pressey, Cowling & Rouget 2003), a global biodiversity hotspot. Cowling et al. (2003) indicate that 60%-70% of a planning domain is usually required for meeting representation and process conservation targets in plans that include multiple features, whereas Soulé and Sanjayan (1998) indicate that 50% would be required if wide-ranging animal species are included. The efficiency of a conservation plan for a rapidly developing and economically active province such as Gauteng is crucial, and reserving large areas of the province for biodiversity conservation is impractical and cannot be justified, especially because only 40% of the vegetation in the province remains in a primary state. The removal of isolated fragments of land of less than 5 ha and all extraneous land within the 100 ha planning units from the final plan without compromising conservation targets is a notable achievement.
Within the CBAs designated for the province, irreplaceable areas (7.1% of the province) are highly sensitive areas that are essential for the conservation of biodiversity in Gauteng and contribute mainly towards the conservation of Threatened, Near Threatened, rare and other conservation-worthy species of fauna and flora, and also to the conservation of the less extensive (< 40 000 ha) vegetation types in the province, with the exception of Springbokvlakte Thornveld. Irreplaceable areas are also crucial for the conservation of aquatic species within the Upper Suikerbosrant quaternary catchment and the Maloney's Eye sub-catchment, as well as for biodiversity dependent on good-quality endorheic pans and the pan clusters located within good condition quaternary catchments. As densely wooded areas occurring on steep slopes and in steep ravines are confined to the irreplaceable areas, these areas also play an important role in climate change adaptation.
The important areas (16.4% of the province) within the CBAs are ecologically sensitive areas that contribute mainly towards the conservation of the more extensive vegetation types and species of Threatened and Near Threatened fauna that require extensive areas for their breeding and survival, such as the Blue Crane, Secretary bird and the spotted-necked otter. Important areas also contribute to the metapopulation persistence of many Threatened and conservation-worthy plant taxa as well as to the metapopulation persistence of the Highveld Blue butterfly, and play an especially important role in climate change adaptation through representation of unique bioclimatic classes. To retain the rivers associated with the Elands, Skeerport and Wilge quaternary catchments in good ecological states, the maintenance of vegetative cover through ecologically sensitive land use is required in areas designated as important.
The existing protected area network, covering 2.4% of the land surface area in the province, is inadequate for the conservation of biodiversity in Gauteng. The high level of conversion to other land uses (irreversible habitat loss has affected 21% of the land surface area in Gauteng) and the loss of primary vegetation have resulted in a conservation plan that appears somewhat fragmented in nature, although connectivity is enhanced through the inclusion of a corridor network. Conservation action directed towards the necessary expansion of the current protected area network, either through formal proclamation of protected areas or through stewardship programmes, should focus on large contiguous areas that are also biodiversity hotspots (Figure 5) as indicated by the summed irreplaceability function in the C-plan decision support system.
The C-plan decision support system can also be used to identify biodiversity features that should be included within a management plan for a protected area, thereby providing the management team with clear management priorities that ensure contribution to a broader conservation strategy. The premier protected areas within Gauteng are clearly the Suikerbosrand Nature Reserve southeast of Johannesburg and the Rietvlei Dam Nature Reserve south of Pretoria. Other important protected areas within the province include the De Onderstepoort, Ezemvelo, Krugersdorp and Rhenosterpoort nature reserves.
Finally, 18.3% of the province is designated as ESAs, which are required for the maintenance and generation of biodiversity in CBAs (i.e. irreplaceable, important and protected areas). ESAs are a crucial part of the conservation plan as they ensure sustainability in the long term.
The Gauteng Conservation Plan is being actively implemented through its incorporation into a number of governmental planning and development tools. It underpins the primary decision support tool for biodiversity assessments in the EIA process that is delegated to provincial government. Together with a standardised set of decision-making guidelines, the plan has allowed for consistent, scientifically justified and defensible recommendations on land development and mining applications. Within the private sector, EIA practitioners rely heavily on the plan when assessing suitability of sites for development. The Gauteng Conservation Plan is also intended to serve as a basis for the gazetting of bioregional plans for municipalities in terms of Section 40 of NEMBA. To date, previous versions of the plan have been used to inform strategic environmental assessments and environmental management frameworks undertaken by GDARD and by other provincial departments in an attempt to avoid sensitive biodiversity areas during, for example, the delineation of the urban edge, the identification of land for low-cost housing and the planning of the future road network. The Gauteng Conservation Plan has also been integrated into the spatial products of local government (such as open space plans and integrated development plans). Nationally, the plan has been instrumental in identifying sensitive geographical areas in terms of the EIA regulations and threatened ecosystems in terms of Section 52 of NEMBA. NEMBA requires that threatened ecosystems be integrated into urban and regional planning, while regulations and biodiversity management plans can also be promulgated for threatened ecosystems. Environmental authorisation is required for any activities that would result in the clearance of indigenous vegetation (area thresholds applicable) within critically endangered or endangered ecosystems, within CBAs in published bioregional plans or within CBAs and ESAs in systematic biodiversity plans such as the Gauteng Conservation Plan.
The Gauteng Conservation Plan Version 3.3 represents a culmination of 10 years of biodiversity planning work in Gauteng, wherein improvements and learning from the collective efforts of the conservation planning community in South Africa were introduced into each version. It is important that provincial conservation efforts now focus on implementation.
Acknowledgements
This article is dedicated to Pieta Compaan. We thank her for her unending commitment to the Gauteng Conservation Plan project - we could not have done it without her. We would also like to thank the numerous people who have played a role in the success of the project: Coral Birss, Daan Buijs, Siyabonga Buthelezi, Willem Coetzer, Dr Stephen Cornelius, Patrick Duigan, Marianne Forsythe-Coetzee, Andra Hennop, Quinton Joshua, Daniel Koen, Rhulani Kubayi, Vuyokazi Mpumlwana, Sizakele Ndzhukula, Reggy Nkosi, Helen Nonyane, Dr Dean Peinke, Deshni Pillay, Hermien Roux, Earnest Seamark and Dr Sue Taylor. Many thanks and special mention go to the field staff team: Richard Koko, Jacob Makola, Aron Matabane, Wilson Molaba, Job Motsamai and Andries Mphuti. Sandra Turck is thanked for the graphic design of Figure 4.
Competing interests
The authors declare that they have no financial or personal relationships that may have inappropriately influenced them in writing this article.
Authors contributions
M.F.P. was the project leader and was also responsible for designing the spatial input layers for plants, vegetation, bioclimatic classes, cost surface, corridor network and the ridges, and ultimately for directing the C-plan analyses to build the Gauteng Conservation Plan. P.C.C. was responsible for all the GIS and C-plan analyses, including preparation of all spatial input layers and building the C-plan database. C.A.W.J., I.E., L.D. and G.M. were responsible for designing the spatial input layers for birds and pans, invertebrates, mammals, and reptiles and amphibians, respectively. L.M. and S.D.W. led the fieldwork teams and contributed significantly to field surveys. P.M. and L.S.N. contributed significantly to designing and preparing the wetland and river layers. S.D.H. conducted the Marxan analysis on the bioclimatic layer, while D.B.H. developed the vegetation map for the province.
References
Allan, D.G., Seaman, M.T. & Kaletja, B., 1995, 'The endorheic pans of South Africa', in G. Cowan (ed.), Wetlands of South Africa, Department of Environmental Affairs and Tourism, Pretoria. [ Links ]
Ball, I.R., Possingham, H.P. & Watts, M., 2009, 'Marxan and relatives: Software for spatial conservation prioritisation', in A. Moilanen, K.A. Wilson & H.P. Possingham (eds.), Spatial conservation prioritisation: Quantitative methods and computational tools, Oxford University Press, Oxford, UK. [ Links ]
Balmford, A. & Bond, W., 2005, 'Trends in the state of nature and their implications for human well-being', Ecology Letters 8, 1218-1234. https://doi.org/10.1111/j.1461-0248.2005.00814.x [ Links ]
Barnes, K.N., 2000, The Eskom red data book of birds of South Africa, Lesotho and Swaziland, BirdLife South Africa, Johannesburg. [ Links ]
Bates, M.F., Branch, W.R., Bauer, A.M., Burger, M., Marais, J., Alexander, G.J. et al. (eds.), 2014, 'Atlas and Red List of the reptiles of South Africa, Lesotho and Swaziland', Suricata 1, South African National Biodiversity Institute, Pretoria. [ Links ]
Bredenkamp, G.J. & Brown, L.R., 2003, 'A reappraisal of Acocks' Bankenveld: Origin and diversity of vegetation types', South African Journal of Botany 69(1), 7-26. https://doi.org/10.1016/S0254-6299(15)30357-4 [ Links ]
Bronner, G., 2008, 'Neamblysomus julianae', in IUCN Red List of Threatened Species. Version 2012.2, viewed 28 January 2013, from http://www.iucnredlist.org. [ Links ]
Bulman, C.R., Wilson, R.J., Holt, A.R., Bravo, L.G., Early, R.I., Warren, M.S. et al., 2007, 'Minimum viable metapopulation size, extinction debt, and the conservation of a declining species', Ecological Applications 17, 1460-1473. https://doi.org/10.1890/06-1032.1 [ Links ]
Burger, L.W., Coetzee, L.A. & Enslin, H., 2000, Air pollution characterisation and preliminary health risk assessment of the proposed Platinum Highway (Warmbaths-Pretoria-Skilpadhek), unpublished report, Environmental Management Services cc, Wierda Park. [ Links ]
Carvalho, K.S. & Vasconcelos, H.L., 1999, 'Forest fragmentation in central Amazonia and its effects on litter-dwelling ants', Biological Conservation 91, 151-157. https://doi.org/10.1016/S0006-3207(99)00079-8 [ Links ]
Chacoff, N.P. & Aizen, M.A., 2006, 'Edge effects on flower-visiting insects in grapefruit plantations bordering premontane subtropical forest', Journal of Applied Ecology 43, 18-27. https://doi.org/10.1111/j.1365-2664.2005.01116.x [ Links ]
Compaan, P., 2011, Technical report: Gauteng conservation plan version 3.3 (C-Plan 3.3), unpublished report for the Gauteng Department of Agriculture and Rural Development, Johannesburg, South Africa, viewed 25 October 2017, from https://www.researchgate.net/publication/315771900_Gauteng_Conservation_Plan_Version_33_C-Plan_33. [ Links ]
Conservation Biology Institute (CBI), 2000, Review of potential edge effects on the San Fernando Valley Spineflower (Chorizanthe parryi var. fernandina), unpublished report prepared for Ahmanson Land Company, West Covina, California & Beveridge & Diamond, LLP, San Francisco, CA. [ Links ]
Cousins, S.A.O., Lavorel, S. & Davies, I., 2003, 'Modelling the effects of landscape pattern and grazing regimes on the persistence of plant species with high conservation value in grasslands in south-eastern Sweden', Landscape Ecology 18, 315-332. https://doi.org/10.1023/A:1024400913488 [ Links ]
Cowling, R.M. & Heijnis, C.E., 2001, 'The identification of Broad Habitat Units as biodiversity entities for systematic conservation planning in the Cape Floristic Region', South African Journal of Botany 67, 15-38. https://doi.org/10.1016/S0254-6299(15)31087-5 [ Links ]
Cowling, R.M., Pressey, R.L., Rouget, M. & Lombard, A.T., 2003, 'A conservation plan for a global biodiversity hotspot - The Cape Floristic Region, South Africa', Biological Conservation 112, 191-216. [ Links ]
Davidson, S., 2000, 'What price biodiversity', Ecos 102, 10-13. [ Links ]
Desmet, P. & Cowling, R., 2004, 'Using the species-area relationship to set baseline targets for conservation', Ecology and Society 9(2), 11. https://doi.org/10.5751/ES-01206-090211 [ Links ]
Donald, P.F. & Evans, A.D., 2006, 'Habitat connectivity and matrix restoration: The wider implications of agri-environment schemes', Journal of Applied Ecology 43, 209-218. https://doi.org/10.1111/j.1365-2664.2006.01146.x [ Links ]
Driver, A., Maze, K., Lombard, A.T., Nel, J., Rouget, M., Turpie, J.K. et al., 2004, South African National Spatial Biodiversity Assessment 2004: Summary report, South African National Biodiversity Institute, Pretoria. [ Links ]
Fischer, J. & Lindenmayer, D.B., 2007, 'Landscape modification and habitat fragmentation: A synthesis', Global Ecology and Biogeography 16, 265-280. https://doi.org/10.1111/j.1466-8238.2007.00287.x [ Links ]
Folke, C., 2006, 'The economic perspective: Conservation against development versus conservation for development', Conservation Biology 20(3), 686-688. https://doi.org/10.1111/j.1523-1739.2006.00446.x [ Links ]
Franklin, J.F., 1993, 'Preserving biodiversity: Species, ecosystems, or landscapes?', Ecological Applications 3, 202-205. https://doi.org/10.2307/1941820 [ Links ]
Gillson, L. & Willis, K.J., 2004 '"As earth's testimonies tell": Wilderness conservation in a changing world', Ecology Letters 7, 990-998. https://doi.org/10.1111/j.1461-0248.2004.00658.x [ Links ]
Graudal, L., Kjær, E.D. & Canger, S., 1995, 'A systematic approach to the conservation of genetic resources of trees and shrubs in Denmark', Forest Ecology and Management 73, 117-134. https://doi.org/10.1016/0378-1127(94)03497-K [ Links ]
Hampe, A. & Petit, R.J., 2005, 'Conserving biodiversity under climate change: The rear edge matters', Ecology Letters 8, 461-467. https://doi.org/10.1111/j.1461-0248.2005.00739.x [ Links ]
Henning, G.A., Terblanche, R.F. & Ball, J.B. (eds.), 2009, 'South African red data book: Butterflies', SANBI Biodiversity Series 13, South African National Biodiversity Institute, Pretoria. [ Links ]
Hilty, J.A. & Merenlender, A.M., 2004, 'Use of riparian corridors and vineyards by mammalian predators in northern California', Conservation Biology 18(1), 126-135. https://doi.org/10.1111/j.1523-1739.2004.00225.x [ Links ]
Hoekstra, J.M., Boucher, T.M., Ricketts, T.H. & Roberts, C., 2005, 'Confronting a biome crisis: Global disparities of habitat loss and protection', Ecology Letters 8, 23-29. https://doi.org/10.1111/j.1461-0248.2004.00686.x [ Links ]
Holway, D.A., 2004, 'Edge effects of an invasive species across a natural ecological boundary', Biological Conservation 121(4), 561-567. https://doi.org/10.1016/j.biocon.2004.06.005 [ Links ]
Hunter, M.L., 2005, 'A mesofilter conservation strategy to complement fine and coarse filters', Conservation Biology 19(4), 1025-1029. https://doi.org/10.1111/j.1523-1739.2005.00172.x [ Links ]
International Union for Conservation of Nature (IUCN), 2001, IUCN Red List categories and criteria: Version 3.1, IUCN Species Survival Commission, IUCN, Gland, Switzerland. [ Links ]
Jump, A.S. & Peñuelas, J., 2005, 'Running to stand still: Adaptation and the response of plants to rapid climate change', Ecology Letters 8, 1010-1020. https://doi.org/10.1111/j.1461-0248.2005.00796.x [ Links ]
Kleynhans, C.J. & Louw, M.D., 2008, River ecoclassification manual for ecostatus determination (version 2). Module A: Ecoclassification and ecostatus determination, Water Research Commission (WRC) Report no. TT 329/08, DWAF & Water for Africa, Pretoria. [ Links ]
Kuussaari, M., Bommarco, R., Heikkinen, R.K., Helm, A., Krauss, J., Lindborg, R. et al., 2009, 'Extinction debt: A challenge for biodiversity conservation', Trends in Ecology & Evolution 24(10), 564-571. https://doi.org/10.1016/j.tree.2009.04.011 [ Links ]
Laurance, W.F., Lovejoy, T.E., Vasconcelos, H.L., Bruna, E.M., Didham, R.K., Stouffer, P.C. et al., 2002, 'Ecosystem decay of Amazonian forest fragments: A 22-year investigation', Conservation Biology 16(3), 605-618. https://doi.org/10.1046/j.1523-1739.2002.01025.x [ Links ]
Lesica, P., 1993, 'Using plant community diversity in reserve design for pothole prairie on the Blackfeet Indian Reservation, Montana, USA', Biological Conservation 65, 69-75. https://doi.org/10.1016/0006-3207(93)90198-A [ Links ]
Lopez, J.E. & Pfister, C.A., 2001, 'Local population dynamics in metapopulation models: Implications for Conservation', Conservation Biology 15(6), 1700-1709. https://doi.org/10.1046/j.1523-1739.2001.00140.x [ Links ]
Low, A.B. & Rebelo, A.G., 1996, Vegetation of South Africa, Lesotho and Swaziland, Department of Environmental Affairs and Tourism, Pretoria, South Africa. [ Links ]
Margules, C.R. & Pressey, R.L., 2000, 'Systematic conservation planning', Nature 405, 243-253. https://doi.org/10.1038/35012251 [ Links ]
Midgely, G.F., Hannah, L., Millar, D., Thuiller, W. & Booth, A., 2003, 'Developing regional and species-level assessments of climate change impacts on biodiversity in the Cape Floristic Region', Biological Conservation 112, 87-97. https://doi.org/10.1016/S0006-3207(02)00414-7 [ Links ]
Miller, J.R., 2005, 'Biodiversity conservation and the extinction of experience', Trends in Ecology and Evolution 20(8), 430-434. https://doi.org/10.1016/j.tree.2005.05.013 [ Links ]
Moilanen, A., Veach, V., Meller, L., Montesino Pouzols, F., Arponen, A. & Kujala, H., 2014, Zonation spatial conservation planning framework and software v. 4.0, user manual, University of Helsinki, Helsinki, Finland. [ Links ]
Mucina, L. & Rutherford, M.C. (eds.), 2006, 'The vegetation of South Africa, Lesotho and Swaziland', Strelitzia 19, South African National Biodiversity Institute, Pretoria. [ Links ]
Noss, R.F., 1987, 'From plant communities to landscapes in conservation inventories: A look at the nature conservancy', Biological Conservation 41, 11-37. https://doi.org/10.1016/0006-3207(87)90045-0 [ Links ]
Noss, R.F., 1996, 'Ecosystems as conservation targets', Trends in Ecology and Evolution 11, 351. https://doi.org/10.1016/0169-5347(96)20058-8 [ Links ]
Opdam, P. & Wascher, D., 2004, 'Climate change meets habitat fragmentation: Linking landscape and biogeographical scale levels in research and conservation', Biological Conservation 117, 285-297. https://doi.org/10.1016/j.biocon.2003.12.008 [ Links ]
Pfab, M.F., 2002, 'An integrative approach for the conservation and management of South Africa's floristic diversity at the provincial level', Biodiversity and Conservation 11, 1195-1204. https://doi.org/10.1023/A:1016045420951 [ Links ]
Pfab, M.F. & Victor, J.E., 2002, 'Threatened plants of Gauteng, South Africa', South African Journal of Botany 68, 374-379. https://doi.org/10.1016/S0254-6299(15)30400-2 [ Links ]
Pfab, M.F., Victor, J.E. & Armstrong, A.J., 2011, 'Application of the IUCN Red Listing system to setting species targets for conservation planning purposes', Biodiversity and Conservation 20, 1001-1012. https://doi.org/10.1007/s10531-011-0009-0 [ Links ]
Pfab, M.F. & Witkowski, E.T.F., 1997, 'Use of geographical information systems in the search for additional populations, or sites suitable for re-establishment, of the endangered Northern Province endemic Euphorbia clivicola', South African Journal of Botany 63, 351-355. https://doi.org/10.1016/S0254-6299(15)30785-7 [ Links ]
Pressey, R.L., Cowling, R.M. & Rouget, M., 2003, 'Formulating conservation targets for biodiversity pattern and process in the Cape Floristic Region, South Africa', Biological Conservation 112, 99-127. https://doi.org/10.1016/S0006-3207(02)00424-X [ Links ]
Pressey, R.L., Watts, M.E., Barrett, T.W. & Ridges, M., 2009, 'The C-Plan conservation planning system: Origins, applications and possible futures', in A. Moilanen, K.A. Wilson & H.P. Possingham (eds.), Spatial conservation prioritisation: Quantitative methods and computational tools, Oxford University Press, Oxford, UK. [ Links ]
Pyke, C.R., 2004, 'Habitat loss confounds climate change impacts', Frontiers in Ecology and the Environment 2(4), 178-182. https://doi.org/10.1890/1540-9295(2004)002[0178:HLCCCI]2.0.CO;2 [ Links ]
Pyke, C.R. & Fischer, D.T., 2005, 'Selection of bioclimatically representative biological reserve systems under climate change', Biological Conservation 121(3), 429-441. https://doi.org/10.1016/j.biocon.2004.05.019 [ Links ]
Raimondo, D., Von Staden, L., Foden, W., Victor, J.E., Helme, N.A., Turner, R.C. et al. (eds.), 2009, 'Red List of South African Plants', Strelitzia 25, South African National Biodiversity Institute, Pretoria. [ Links ]
Robinson, J.G., 2006, 'Conservation biology and real-world conservation', Conservation Biology 20(3), 658-669. https://doi.org/10.1111/j.1523-1739.2006.00469.x [ Links ]
Rodrigues, A.S.L. & Gaston, K.J., 2001, 'How large do reserve networks need to be?', Ecology Letters 4, 602-609. https://doi.org/10.1046/j.1461-0248.2001.00275.x [ Links ]
Root, T.L. & Schneider, S.H., 2006, 'Conservation and climate change: The challenges ahead', Conservation Biology 20(3), 706-708. https://doi.org/10.1111/j.1523-1739.2006.00465.x [ Links ]
SANBI, 2013, Statistics: Red List of South African plants version 2013.1, viewed 07 January 2014, from http://redlist.sanbi.org. [ Links ]
Schtickzelle, N., Choutt, J., Goffart, P., Fichefet, V. & Baguette, M., 2005, 'Metapopulation dynamics and conservation of the marsh fritillary butterfly: Population viability analysis and management options for a critically endangered species in Western Europe', Biological Conservation 126(4), 569-581. https://doi.org/10.1016/j.biocon.2005.06.030 [ Links ]
Scott, J.M., Ables, E.D., Edwards, T.C., Eng, R.L., Gavin, T.A., Harris, L.D. et al., 1995, 'Conservation of biological diversity: Perspectives and the future for the wildlife profession', Wildlife Society Bulletin 23(4), 646-657. [ Links ]
Semlitsch, R.D. & Bodie, J.R., 2003, 'Biological criteria for buffer zones around wetlands and riparian habitat for amphibians and reptiles', Conservation Biology 17, 1219-1228. https://doi.org/10.1046/j.1523-1739.2003.02177.x [ Links ]
Shafer, C.L., 1999, 'US National Park buffer zones: Historical, scientific, social and legal aspects', Environmental Management 23, 49-73. https://doi.org/10.1007/s002679900167 [ Links ]
Skinner, J.D. & Chimimba, C.T., 2005, The mammals of the Southern African subregion, 3rd edn., Cambridge University Press, Cambridge, UK. [ Links ]
Soulé, M.E. & Sanjayan, M.A., 1998, 'Conservation targets: Do they help?', Science 279, 2060-2061. https://doi.org/10.1126/science.279.5359.2060 [ Links ]
South African Bird Atlas Project 2, viewed 25 January 2016, from http://sabap2.adu.org.za. [ Links ]
Thomas, C.D., Cameron, A., Green, R.E., Bakkenes, M., Beaumont, L.J., Collingham, Y.C. et al., 2004, 'Extinction risk from climate change', Nature 427, 145-148. https://doi.org/10.1038/nature02121 [ Links ]
Victor, J.E. & Keith, M., 2004, 'The Orange List: A safety net for biodiversity in South Africa', South African Journal of Science 100, 139-141. [ Links ]
Watkins, R.Z., Chen, J., Pickens, J. & Brosofske, K.D., 2003, 'Effects of forest roads on understory plants in a managed hardwood landscape', Conservation Biology 17(2), 411-419. https://doi.org/10.1046/j.1523-1739.2003.01285.x [ Links ]
Whittington-Jones, C.A., 2007, The status and importance of ephemeral pans in Gauteng, unpublished report, Gauteng Directorate of Nature Conservation, Johannesburg, South Africa. [ Links ]
Whittington-Jones, C.A., West, S., Matabane, A., Koko, R., Molaba, W., Motsamai, J. et al., 2008, The herpetofauna of Gauteng. Volume 1: Distribution and status of reptiles, unpublished report, Gauteng Directorate of Nature Conservation, Johannesburg, South Africa. [ Links ]
Whittington-Jones, C.A., West, S., Matabane, A., Koko, R., Molaba, W., Motsamai, J. et al., 2009, The herpetofauna of Gauteng. Volume 1: Distribution and status of amphibians, unpublished report, Gauteng Directorate of Nature Conservation, Johannesburg, South Africa. [ Links ]
Williams, P., Hannah, L., Andelman, S., Midgely, G., Araújo, M., Hughes, G. et al., 2005, 'Planning for climate change: Identifying minimum-dispersal corridors for the Cape Proteaceae', Conservation Biology 19(4), 1063-1074. https://doi.org/10.1111/j.1523-1739.2005.00080.x [ Links ]
Wilsey, B.J., Martin, L.M. & Polley, H.W., 2005, 'Predicting plant extinction based on species-area curves in prairie fragments with high beta richness', Conservation Biology 19(6), 1835-1841. https://doi.org/10.1111/j.1523-1739.2005.00250.x [ Links ]
Yetman, C.A. & Ferguson, J.W.H., 2011, 'Conservation implications of spatial habitat use by adult giant bullfrogs (Pyxicephalus adspersus)', Journal of Herpetology 45(1), 56-62. https://doi.org/10.1670/09-186.1 [ Links ]
Zeng, H., Sui, D.Z. & Wu, X.B., 2005, 'Human disturbances on landscapes in protected areas: A case study of the Wolong Nature Reserve', Ecological Research 20(4), 487-496. https://doi.org/10.1007/s11284-005-0065-6 [ Links ]
 Correspondence:
Michèle Pfab
m.pfab@sanbi.org.za
Received: 19 Sept. 2016
Accepted: 12 Sept. 2017
Published: 30 Nov. 2017

