


Servicios Personalizados
Articulo
 Inglés (pdf)
 Articulo en XML
 Referencias del artículo
Indicadores

Links relacionados
-
 Citado por Google
 -
 Similares en Google
Compartir

 Permalink
Bothalia - African Biodiversity & Conservation
versión On-line ISSN 2311-9284
versión impresa ISSN 0006-8241
Bothalia (Online) vol.46 no.2 Pretoria 2016
http://dx.doi.org/10.4102/abc.v46i2.2118
ORIGINAL RESEARCH
Identifying ecosystem service hotspots for environmental management in Durban, South Africa
Rashieda DavidsI; Mathieu RougetII; Richard BoonIII, V; Debra RobertsIV, V
ISchool of Agricultural, Earth and Environmental Sciences, University of KwaZulu-Natal, South Africa
IICentre for Invasion Biology, School of Agriculture, Earth and Environmental Sciences, University of KwaZulu-Natal, South Africa
IIIEnvironmental Planning and Climate Protection Department, eThekwini Municipality, Durban, South Africa
IVSustainable and Resilient City Initiatives Unit, eThekwini Municipality, South Africa
VSchool of Life Sciences, University of KwaZulu-Natal, South Africa
ABSTRACT
BACKGROUND: Despite considerable research into the importance of ecosystem services, little has been achieved in translating such research into management action. In an urban context where numerous pressures on ecosystem services exist, the identification and management of priority ecosystem services areas are vital to ensure the ongoing provision of these services.
METHOD: To identify opportunities for securing a sustainable supply of ecosystem services for the city of Durban, this paper identifies ecosystem service priority areas, called hotspots, and assesses their spatial congruence with critical biodiversity areas (CBAs), conservation areas, the Durban Metropolitan Open Space System (D'MOSS) and land ownership categories, using spatial overlap and correlation analyses. Hotspots for 13 ecosystem services were identified and analysed, including carbon storage, nutrient retention, sediment retention, water supply and flood attenuation.
RESULTS: The study found generally weak correlations between ecosystem service hotspots and CBAs and conservation areas. On average, 30% of the 13 ecosystem services hotspots were located within terrestrial CBAs, 51% within the D'MOSS, with nominal overlaps of 0.3%, 3.9% and 5.07% within estuaries and freshwater CBAs and conservation areas, respectively. The majority of ecosystem service hotspots were located within communally (41%) or privately owned (27%) lands.
CONCLUSION: The results indicated that substantial portions of hotspot areas lie outside of formally regulated and managed conservation areas and remain vulnerable to human impact and habitat degradation. The study identified management areas and options that could yield maximum benefits; including the need for the development of an ecosystem services management and protection strategy, the selection of areas for co-management of ecosystem service hotspots and CBAs and the need for collaborative management.
Introduction
Ecosystems and the services they provide are essential in ensuring human well-being and providing the basis for sustainable socio-economic development (South African Department of Environmental Affairs (DEA) 2011). The global population is predicted to grow from 7.3 billion in 2015 to 11.2 billion in 2100 (United Nations, Department of Economic and Social Affairs (UN DESA) 2015). Approximately 60% of the world's ecosystem services (17 of the 21 assessed), including fisheries and fresh water, is already degraded or used unsustainably (Millennium Ecosystem Assessment (MEA) 2005). Globally, humans are at risk of pushing earth systems out of the fairly stable, 11 700-year long Holocene epoch, to a state likely to be much less hospitable for anthropogenic development (Intergovernmental Panel on Climate Change (IPCC) 2012, 2013; Steffen et al. 2004, 2015). This unsustainable development path is expected to have implications for ecosystem services and human well-being (McGranahan et al. 2005). In Africa, where the population is expected to increase from 1.2 billion to 4.3 billion between 2015 and 2100 (UN DESA 2015), the capacity of natural resources to produce ecosystem services has already declined as a result of inappropriate management, threatening the social and economic value of these services for the human societies they support (Munang et al. 2011).
It was clear from the Millennium Ecosystem Assessment (MEA 2005) that the management and protection of ecosystem services is vital to support human development. Subsequent to the findings of the MEA has been the rapid growth in science and policy attention on the subject (Convention on Biological Diversity (CBD) 2010; Daily et al. 2009; Intergovernmental Science-Policy Platform on Biodiversity and Ecosystem Services (IPBES) 2012; TEEB Foundations 2010). Several policies and strategies focused on the conservation of biodiversity - defined as the variability, diversity and ecological complexes amongst living organisms, species and ecosystems (Republic of South Africa 2004) - now explicitly also include objectives to monitor, assess and protect ecosystem services (e.g. CBD 2010, EC 2010). For example, IPBES was established with the key objective to ensure long-term human well-being and sustainable development, through the conservation and sustainable use of biodiversity and ecosystem services (CBD 2010, IPBES 2012). The Economics of Ecosystems and Biodiversity (TEEB) initiative undertaken by the UN Environment Programme and initiated in 2007 (TEEB Foundations 2010) was aimed at mainstreaming the values of biodiversity and ecosystem services into decision-making at all levels (Costanza et al. 2014). Many countries have welcomed the findings from TEEB and plan to take some of the recommendations forward (Kumar & Martinez-Alier 2011).
However, many challenges remain in translating scientific knowledge generated through biodiversity and ecosystem services assessments to real-world decision making (Ruckelshaus et al. 2015). These include the identification of priority ecosystem service areas and the appropriate planning, protection and management of these through policy, or public and private sector practise (Goldman et al. 2008; Laurans et al. 2013).
Aligning ecosystem services and biodiversity objectives became a common conservation strategy to address these challenges, subsequent to the findings of studies on local to regional scale that identified the coincidence of ecosystem service value with biodiversity. The establishment of protected areas was identified as a tool to ensure biodiversity conservation and safeguard ecosystem services (Chan et al. 2006; Naidoo & Adamowicz 2005; Naidoo & Ricketts 2006; Turner et al. 2007). It is known that effectively managed protected areas augment ecosystem services linked to natural areas, such as water regulation, soil and climate (Willemen et al. 2013) and that high levels of biodiversity can play a significant role in either regulating processes and functions of ecosystem services or directly providing them (Balvanera et al. 2006; Diaz et al. 2005). Evidence shows that increased biodiversity has positive effects on ecosystem services (Balvanera et al. 2006; Diaz et al. 2005); however, it is still unclear whether the level of co-occurrence of ecosystems services and biodiversity could allow for synergies towards the achievement of objectives for both (Balvanera et al. 2006; Turner et al. 2007). In cities, there are limited options for managing biodiversity given competing demands for land. For example, in Durban, South Africa, environmental transformation and degradation continue to increase, as substantial human need and poverty still exist (Roberts & O'Donoghue 2013). This adds to the complexities in managing biodiversity and ecosystem services in an urban context.
Another key challenge for environmental management, as emphasised by Escobedo et al. (2011), is the willingness of planners and decision-makers to assess ecosystem services against ecosystem disservices (Lyytimäki & Sipilä 2009). Ecosystem disservices are classified as the nuisances or negative effects to humans from natural or human-impacted ecosystems, such as biological hazards, invasive species, floods, storms, heat waves and pests (Lyytimäki & Sipilä 2009; von Döhren & Haase 2015). The consideration of ecosystem disservices may add a valuable dimension to the ecosystem services management debate; however, in this study we focussed only on beneficial ecosystem services.
In an attempt to identify synergies for the management and protection of selected ecosystem services with biodiversity, this paper uses the greater Durban area (also known as the eThekwini Municipal Area (EMA)) as a case study to identify important areas for ecosystem services provision (called 'ecosystem service hotspots') of 13 ecosystem services. We assesses the extent to which these areas are identified as conservation priorities in relation to the eThekwini Municipality Draft Systematic Conservation Plan (2012b); namely, (1) as critical biodiversity areas, (2) as conservation areas and (3) as part of the Durban Metropolitan Open Space System (D'MOSS). We then assess their distribution relative to various categories of ownership and propose opportunities for the protection and management of ecosystem service hotspots in an urban context through policy and practise.
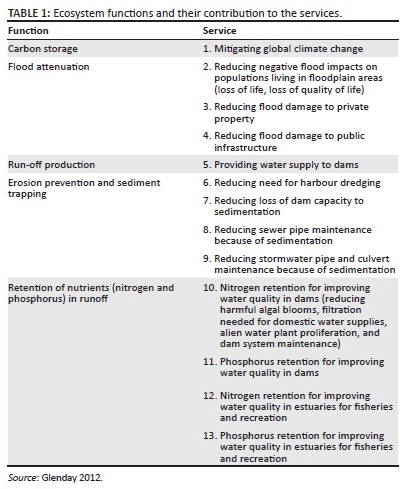
Recent regional and international studies have only considered a limited number of ecosystem services (usually between four and six) (Chan 2006; Egoh et al. 2009; Jantz & Manuel 2013; Pan, Xu & Wu 2013). The availability in Durban of 13 ecosystem service layers (Glenday 2012, Table 1) therefore offered a good opportunity to analyse spatially a larger number of individual ecosystem services on the local scale. These ecosystem service layers were identified to inform the conservation planning process within the municipality and to facilitate the selection of priority areas where management efforts would yield maximum benefits. The current study aimed to further inform the conservation planning process by answering the following questions:
-
Where are the most significant areas providing the 13 ecosystem services in eThekwini Municipality, i.e. ecosystem service hotspots?
-
What is the spatial congruence of ecosystem service hotspots?
-
What is the spatial congruence of ecosystem service hotspots and critical biodiversity and conservation areas?
-
How do the ecosystem service hotspots align with the existing environmental policy layer: D'MOSS?
-
How are the ecosystem service hotspots distributed relative to land ownership?
-
This study contributes towards bridging the gap between planning and implementation of ecosystem services in Durban.
Research method and design
Study area
The EMA is situated in the province of KwaZulu-Natal, South Africa, and is administered by eThekwini Municipality, a local government authority. The municipal area is approximately 229 193 ha in extent (1.4% of the province), with a coastline that stretches for 98 km, and which is dissected by the rivers of 18 major water catchments and 16 estuaries. The population of eThekwini Municipality was 3.55 million in 2015. Between 2012 and 2013, the population growth rate was 0.9% (eThekwini Municipality 2013a). Approximately two-thirds of the municipal area is rural or semi-rural, where a large portion of the population is indigent and directly reliant on ecosystem services for basic needs (Roberts & O'Donoghue 2013).
Numerous pressures on biodiversity and ecosystem services provision are present within the EMA. The greatest of these are considered to be habitat destruction, invasive alien species and pollution (eThekwini Municipality 2012a). Since 1982, a process of identifying biodiversity priority areas in Durban has been undertaken by a range of institutions. The first open space plan known as D'MOSS was approved by the former Durban Council in 1989 and since 1994 the further development of the plan has been the responsibility of the Environmental Planning and Climate Protection Department (EPCPD) of the eThekwini Municipality. D'MOSS is a formal policy layer, including a series of interconnected open spaces that incorporate areas of high biodiversity value and natural areas. The purpose of D'MOSS is to protect the globally significant biodiversity and ecosystem services within the city (Roberts & O'Donoghue 2013). D'MOSS was incorporated into the eThekwini Municipal Town Planning Schemes in 2010 as a controlled development layer (Roberts & O'Donoghue 2013), representing the first time that an open space plan had been officially incorporated into the town planning schemes of a major metropolitan area in South Africa.
Data
Ecosystem services
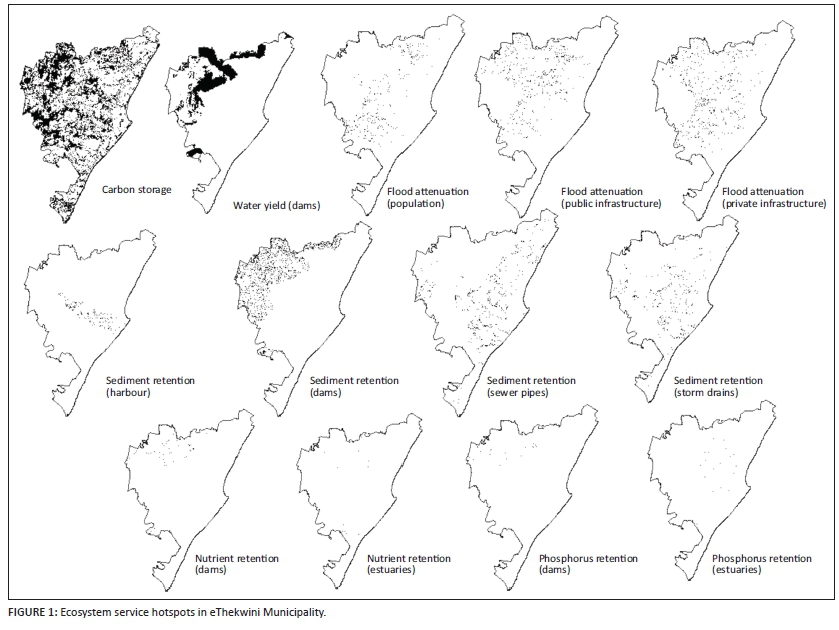
In 2012, the EPCPD commissioned the mapping of 13 ecosystem services, namely carbon storage, water yield (to dams), three flood attenuation services (relevant to the population, private and public infrastructure), four sediment retention services (preventing sedimentation of dams, stormwater and sewer pipes and the harbour) and four nutrient retention services (phosphorus and nitrogen relative to both dams and estuaries) (Table 1). These ecosystem services were chosen in a workshop that included officials and managers from the EPCPD and the Coastal Stormwater and Catchment Management Department, based on the demand for those services in relation to the service mandates of these municipal departments. The 13 spatial layers representing these ecosystem services were produced using the InVEST mapping tool developed by the Natural Capital Project, which allows key or priority ecosystem services to be identified based on a number of factors, either contributing to or impacting on selected ecosystem services (Glenday 2012).
The original ecosystem service layers were linked to a standard 86.9 m resolution grid and were rescaled to values ranging from 0 to 100 to indicate relative service provision compared to the maximum found in the EMA (Glenday 2012). The ecosystem services were assessed per grid cell in ArcGIS 9.3 and estimated based on land cover, location and biophysical properties. The demand for that service in that grid cell location was estimated based on its position relative to populations, property and infrastructure located downstream, along land surface and river channel flow paths (Glenday 2012).
Critical biodiversity areas
The following three critical biodiversity areas (areas of high conservation significance) were extracted from the eThekwini Municipality (Draft Systematic Conservation Plan 2012b) for this study:
-
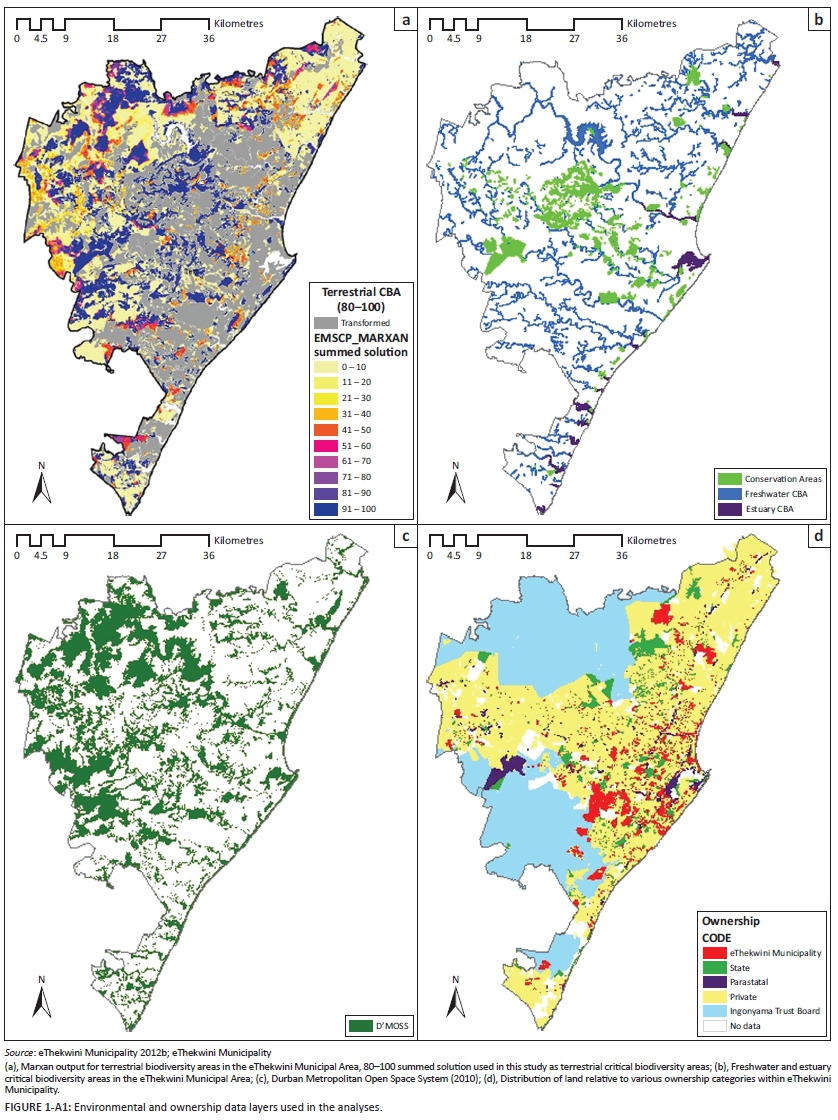
Terrestrial critical biodiversity areas (Figure 1a-A1): These are land-based areas of high conservation significance selected to meet targets for various biodiversity features and processes.
-
Estuarine critical biodiversity areas (Figure 1b-A1): Despite the fact that the Draft Systematic Conservation Plan selected only 14 of the 16 estuaries in the EMA, given the significant habitat loss of estuarine areas (as defined by the 5 m contour) within the municipal area and the highly conservative species targets used, for the purposes of the conservation plan, all 16 estuaries were classified as critical biodiversity areas.
-
Freshwater critical biodiversity areas (Figure 1b-A1): These included riparian corridors and all mapped wetland systems.
-
The original vector files were converted to raster grids and standardised to the ecosystem services raster files.
Durban Metropolitan Open Space System
The version of the D'MOSS layer, approved by eThekwini Council in December 2010, was obtained from eThekwini Municipality, converted to a raster grid and standardised to the ecosystem service raster (Figure 1c-A1, eThekwini Municipality). Currently, only ~10% of the D'MOSS area is protected and 8.6% is managed (e.g. through appropriate conservation zoning, conservation servitudes and land acquisition) (eThekwini Municipality 2015). The D'MOSS areas that fall outside of formally managed areas are identified for protection on an ongoing basis, based on an internal prioritisation process, through inter alia land acquisition and stewardship programmes, or through conservation servitudes, which are used to secure D'MOSS areas as a condition of approval for new developments.
Conservation areas
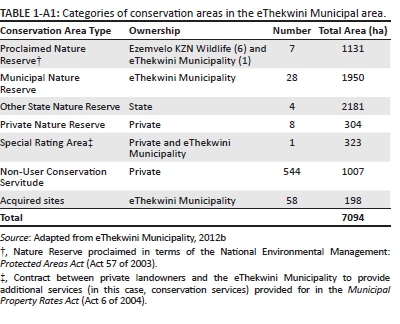
Conservation area data Table 1-A1, Figure 1b-A1 were obtained from eThekwini Municipality (2012b) and converted to a raster grid. These areas include land that has been secured for conservation purposes by any binding legal or other agreement, including areas that have been proclaimed, municipal, state and private nature reserves, where conditions have been imposed by the title deed such as a servitude. In most cases, these protection measures were instituted by the EPCPD as part of securing D'MOSS (Roberts & O'Donoghue 2013).
In 2012, all land that was zoned for conservation on private property, state or eThekwini Municipality owned property was included in the conservation area data layer (eThekwini Municipality 2012b). Some of these zones, however, have since been rescinded because of technicalities relating to the incorporation of those zones in the relevant schemes, and those areas have thus been excluded from this study.
Land ownership
The spatial layer containing all land ownership information was obtained from eThekwini Municipality and was converted to a raster grid. The ownership data contained numerous parcels that did not have any ownership information, shown as 'No data' in Figure 1d-A1 Five categories of ownership exist within the EMA (Figure 1d-A1), namely (1) municipal owned; (2) state owned (national and provincial government); (3) parastatal owned; (4) privately owned and 5) Ingonyama Trust Board administered (communal ownership). A brief description of each ownership category is provided below.
eThekwini Municipality is the local authority responsible for managing and planning the EMA, including the city of Durban. The municipality owns approximately 9970 ha (4.3%) of land, of which the natural areas constitute nature reserves, parks, public open spaces and land acquired for environmental protection. The natural areas are largely managed by two municipal departments, namely the EPCPD and the Natural Resources Division of the Parks, Leisure and Cemeteries Department. These departments undertake various environmental protection and management activities, including conservation planning to identify priority biodiversity and ecosystem service areas, biodiversity impact assessment and regulation (including providing comments on Environmental Impact Assessments as part of development applications), land acquisition, implementation of various town planning tools (e.g. conservation servitudes, special rating areas and rezoning), invasive alien species control, fire management and biodiversity stewardship (eThekwini Municipality 2011a, 2013a, 2014; Roberts & O'Donoghue 2013).
State-owned land constitutes approximately 9175 ha (4.0%) of the municipal area. Ezemvelo KwaZulu-Natal Wildlife is the statutory nature conservation body mandated to protect natural resources, manage biodiversity and implement and enforce both national and provincial conservation legislation in the province of KwaZulu-Natal. This body manages six formally proclaimed nature reserves which is a sub-set of the state-owned land in the municipal area (Dube 2011).
Parastals own approximately 3405 ha (1.5%) of land within the municipal area and include Umgeni Water, South African Rail Commuter Corporation (PRASA) and South African Roads Agency (SANRAL). Some of these agencies have various types of environmental management programmes in place, including management of certain conservation areas in Durban (e.g. Shongweni Resources Reserve and Bayhead Mangroves).
Ingonyama Trust Board (ITB), which administers large areas of communal lands, was established in terms of the KwaZulu-Natal Ingonyama Trust Act (Act 3 of 1994). The Board is the landowner-in-law of some 2 700 000 hectares in Kwazulu-Natal, under the jurisdiction of 250 traditional councils (Ingonyama Trust Board 2012). Of this total, approximately 82 266 ha (35.8%) are located within the rural hinterland in the northwest and southwest areas of the municipality, where communities depend on ecosystem services to meet their basic and service needs (Sutherland et al. 2014). The primary function of the Ingonyama Trust Board is to improve the quality of life of the people living on Ingonyama Trust land and to manage the land for the benefit and social well-being of the individual members of the tribes (Ingonyama Trust Board 2012). Whilst municipal plans show these ITB areas to be rural, the current rate of development that is taking place without development restrictions or planning is resulting in the rapid transformation of these areas through the construction of new residential developments (Sim, Sutherland & Scott 2016).
Approximately 82 796 ha (36.0%) of land is privately owned within the municipal area. Of this just over 1000 ha (< 2%) (Table 1-A1) is subject to some form of environmental management and includes areas that (1) form part of stewardship programmes currently offered by Ezemvelo KwaZulu-Natal Wildlife (i.e. a private nature reserve that is actively managed); (2) are listed as special rating areas1; (3) hold environmental rates certificates in line with the eThekwini Municipality Rates Policy, requiring management in line with an approved management plan; and (4) have registered non-user conservation servitudes.
Approximately 42 405 ha (18.4%) of land within the EMA did not have ownership data available. Reasons for this include the fact that a large number of parcels were not registered at the time of mapping. The majority of areas that do not contain ownership information include roads and rivers.
The assessment of ecosystem service hotspots in relation to ownership categories was included to provide insight into the potential opportunities and challenges for the protection and management of ecosystem services in Durban.
Analysis
Ecosystem service hotspots
The aim of the study was to identify ecosystem service hotspots and to analyse hotspots in terms of their distribution relative to critical biodiversity and conservation areas, D'MOSS and land ownership within the EMA. The term 'biodiversity hotspot', as proposed by Norman Myers in the 1980s, is commonly used to prioritise areas for biodiversity conservation and refers to areas of high species richness, endemism and threat (Myers 1988). Whilst threats and endemism were not considered in this study, the term 'ecosystem service hotspot' refers here to important ecosystem service provisioning areas based on the 13 ecosystem services that were analysed.
In order to select the top 50% of ecosystem service provision areas, ecosystem service hotspots were defined for each of the 13 ecosystem services based on grid cells that contain ecosystem service values greater than the median value. Statistically, under certain conditions of contamination (frequency of outliers in a sample) the median has often been proposed as an estimator for the mean (Dixon 1953) and when a distribution is skewed, the median can be used as a measure of location to reduce the importance attached to outliers (Press et al. 1992). In this study, the median was used in order to account for the outliers present in the range of ecosystem service values, as the use of the mean (that would usually be used to identify the central value) would have resulted in the exclusion of large areas providing good levels of ecosystem services. For example, the median value for carbon storage was 17, and for sediment retention to dams 1.8 (Table 2). Note that not all areas within the municipal area contribute to ecosystem service provision. For example, only 8% of the total area provides some level of sediment retention for dams.
Albeit many of the grid cells selected as hotspots for individual ecosystem services do not score highly on a scale of 0-100, it is important to note that these areas have been mapped in a fragmented urban environment that has been subjected to high levels of transformation and habitat loss. In this case, replication of representative samples of communities, or key ecosystem service areas, within an open space system are important as these areas could be lost as a result of natural catastrophes or political pressure for alternative land uses (Roberts 1994).
Spatial congruence assessment
This study used methods commonly used to assess spatial congruence, namely spatial overlap and correlations (Chan et al. 2006; Egoh et al. 2009; Orme et al. 2005; Prendergast et al. 1993; van Jaarsveld et al. 1998). For example, Turner et al. (2007) overlaid biodiversity conservation priorities with global terrestrial ecosystem services to identify the spatial correspondence (or lack thereof) between them. Similarly, Chan et al. (2006) evaluated the spatial correspondence of biodiversity and ecosystem services using service correlation and overlap tests. Both correlation and overlap analyses were considered necessary, as the correlation analyses between ecosystem services do not completely provide the extent to which conservation activities for selected services would align (Chan et al. 2006). More specifically, if ecosystem services and biodiversity areas overlap in terms of their geographic locations, they may not necessarily be correlated, in which case, an increase in (or high) biodiversity importance would not necessarily be accompanied by an increase in (or high) ecosystem service value. Similar to Chan et al. (2006), this study used both overlap and correlation analyses.
Overlay analyses
Percentage overlaps were identified by overlaying each ecosystem service hotspot with (1) the remaining ecosystem service hotspots; (2) critical biodiversity areas; (3) conservation areas; (4) D'MOSS; and (5) categories of ownership, using ArcGIS 10.1 tools, namely Raster Calculator and Sample.
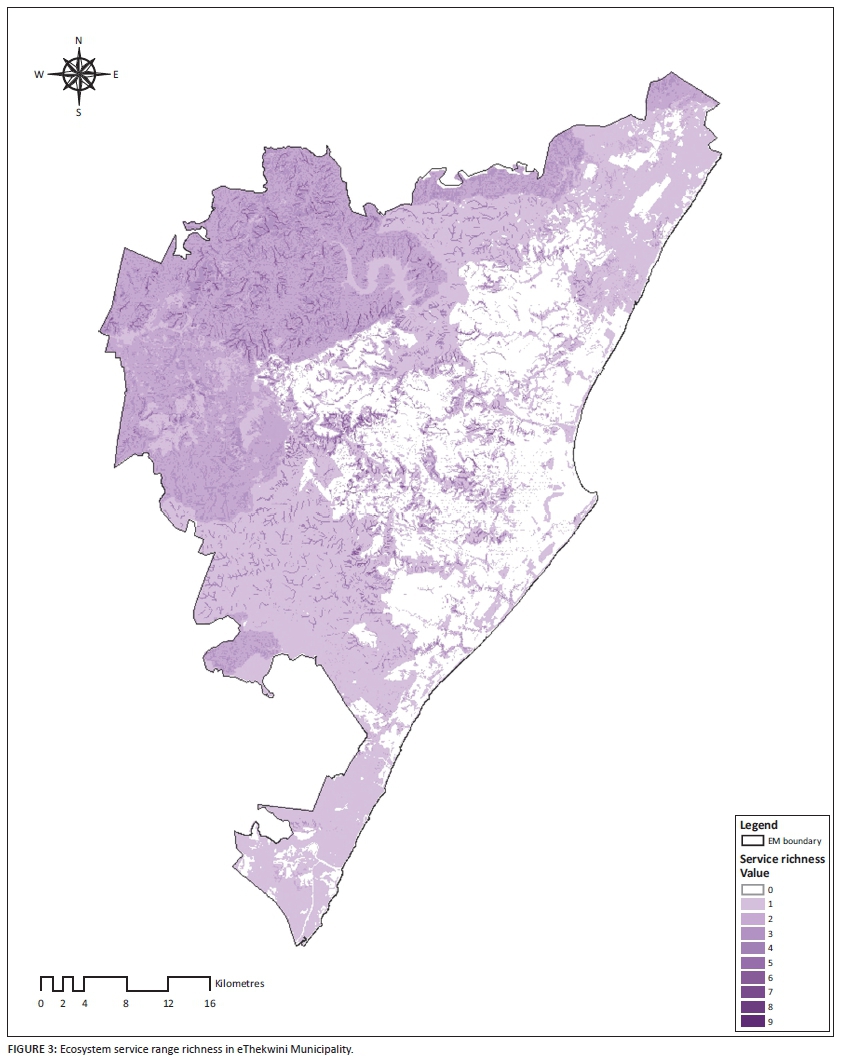
Overlay analysis of all ecosystem service hotspots was also used to identify ecosystem service ranges and hotspot richness. The latter is measured by the number of ecosystem services for which one grid cell is considered to be a hotspot. The ecosystem service ranges in this study comprise the complete spatial extent of ecosystem services as originally mapped by Glenday (2012). For this analysis, the binary grids of each ecosystem service were overlaid to identify those grid cells that contain a combination of ecosystems services.
Correlations
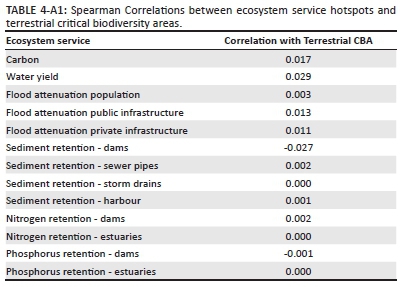
The relationships between the 13 mapped ecosystem service hotspots, and ecosystem service hotspots and terrestrial critical biodiversity areas were identified using two tools within the ArcGIS 10.1 toolbox, namely Spearman correlations (Band Collection Statistics) and Sample. Positive correlations indicate that the variables assessed increase or decrease in parallel, whilst negative correlations indicate that whilst one variable increases, the other decreases.
Results
Ecosystem service range and hotspots
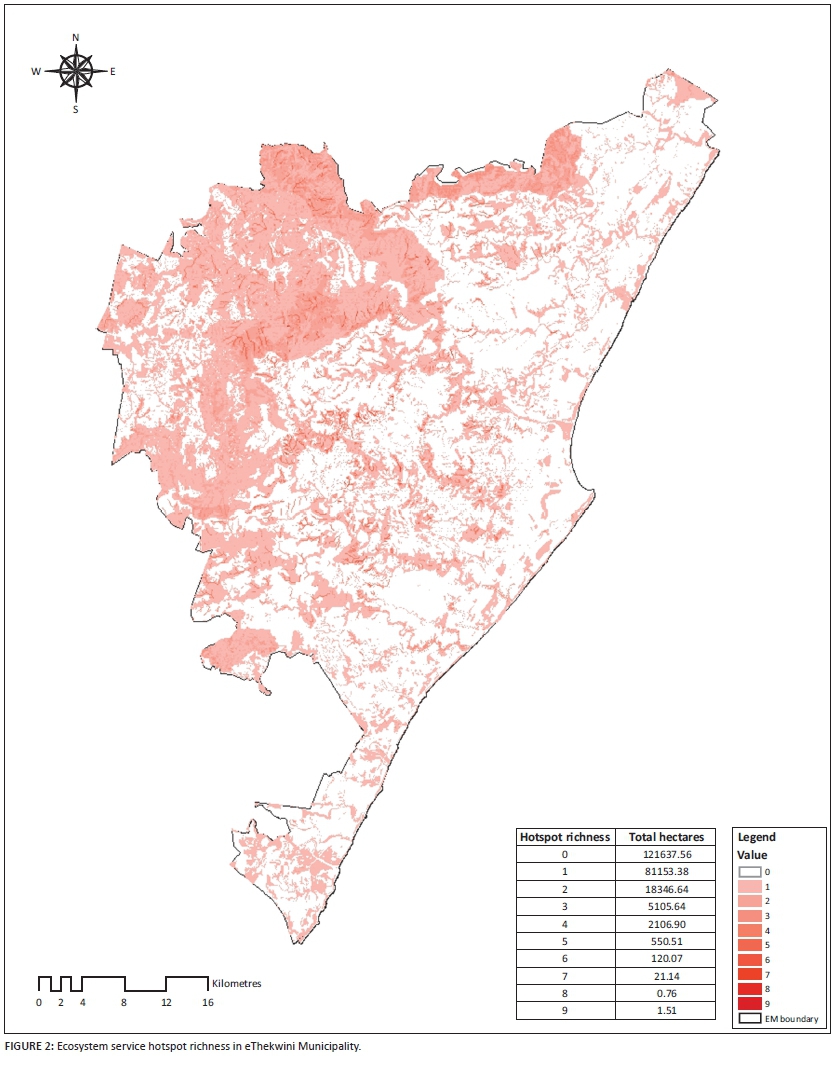
The ecosystem service hotspots identified constitute the top 50% of ecosystem service provisioning areas (Figure 1). The combined ecosystem service hotspots (hotspot richness) cover approximately 46% of the entire municipal area (Figure 2), whilst the range of ecosystem services (ecosystem service range richness) covers approximately 74% of the municipal area (Figure 3).
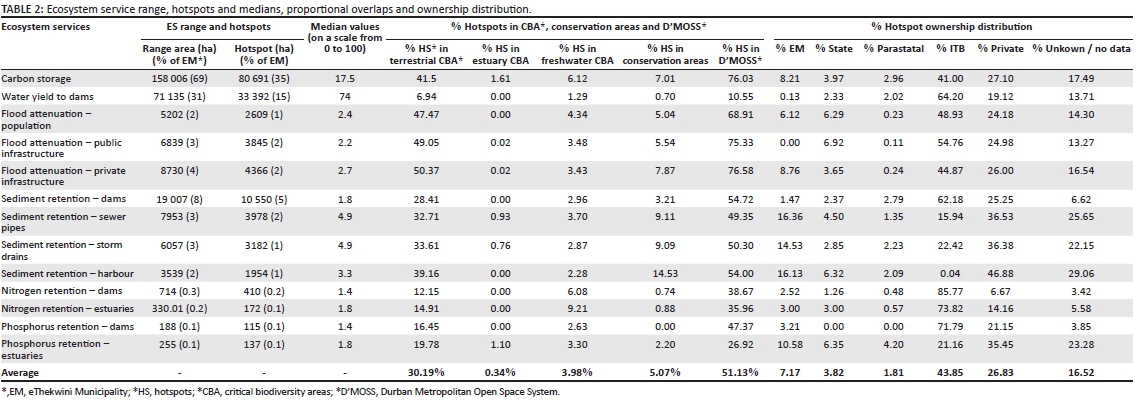
In terms of area distribution, the EMA contributes substantially to three key services, namely carbon storage, water yield (supply) to dams and sediment retention for dams, whilst the remaining ecosystem service ranges and hotspots occupy far smaller areas (Table 2).
With respect to hotspot richness (Figure 2), as calculated per grid cell, the majority of the municipal area is important for only one of the 13 services assessed. In addition, few grid cells contain combinations of services, resulting in limited overlapping of ecosystem service provisioning. For example, less than 2% (5100 ha) of the municipal area supplies a combination of three or more of the 13 service hotspots and approximately 550 ha supplies a combination of five service hotspots (Figure 2). However, the level of overlap may have been different if additional ecosystem services were included in the assessment.
Spatial overlaps between ecosystem services hotspots, critical biodiversity areas, conservation areas and D'MOSS
On average, 30.2% of ecosystem service hotspots are located within terrestrial critical biodiversity areas, 51.1% within D'MOSS, with nominal overlaps of 0.3%, 3.9% and 5.1% within estuaries and freshwater critical biodiversity areas and conservation areas, respectively (Table 2). All ecosystem services except phosphorus retention for dams were found to overlap with conservation areas.
Terrestrial critical biodiversity areas contain significant proportions of carbon storage (41.5%), all three flood attenuation services (47.5%-50.4%) and sediment retention service hotspots (28.4%-39.2%) (Table 2). Terrestrial critical biodiversity areas showed minor overlaps with nitrogen and phosphorus retention services (12.1%-19.8%), with the smallest overlap being with the water yield service hotspots (7%).
Despite that all ecosystem services except phosphorus retention for dams were found to overlap to some extent with conservation areas, given the limited areas of overlap, most ecosystem service hotspots are unprotected (Table 2). The small percentage overlap between 1% and 14% of hotspots with conservation areas highlights that substantial proportions of ecosystem services lie outside these areas, leaving them vulnerable to human impact and degradation.
All categories of ecosystem service hotspots were represented within D'MOSS, of which carbon storage (76%) and all flood attenuation hotspots (68%-77%) have the highest representation. About half of all three sediment retention ecosystem service hotspots were contained within D'MOSS (49%-55%), whilst water yield service was identified to have the smallest overlap with D'MOSS (11%).
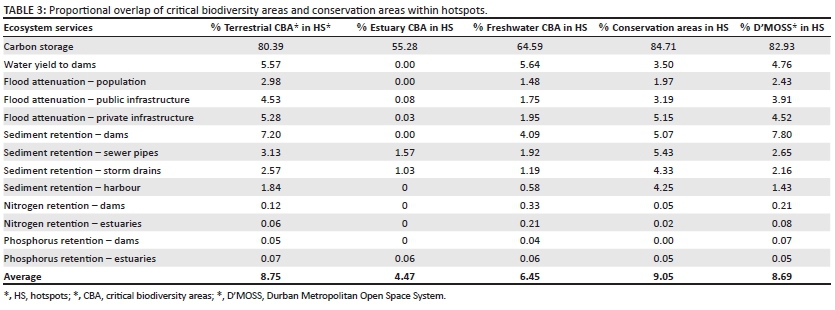
With respect to the proportions of critical biodiversity and conservation areas found in ecosystem service hotspots, on average, ecosystem service hotspot areas in this study contained small percentages of critical biodiversity areas, with 8.8% of terrestrial critical biodiversity areas, 4.5% of estuary critical biodiversity areas and 6.5% of freshwater critical biodiversity areas (Table 3).
Most ecosystem service hotspots were unprotected (Table 2). Generally, conservation areas performed poorly with regards to the ecosystem services included in this study, with small percentages of conservation areas being contained within hotspots, except for carbon storage (80% of conservation areas overlap with carbon storage hotspot) (Table 3).
Correlations between ecosystem services ranges and hotspots
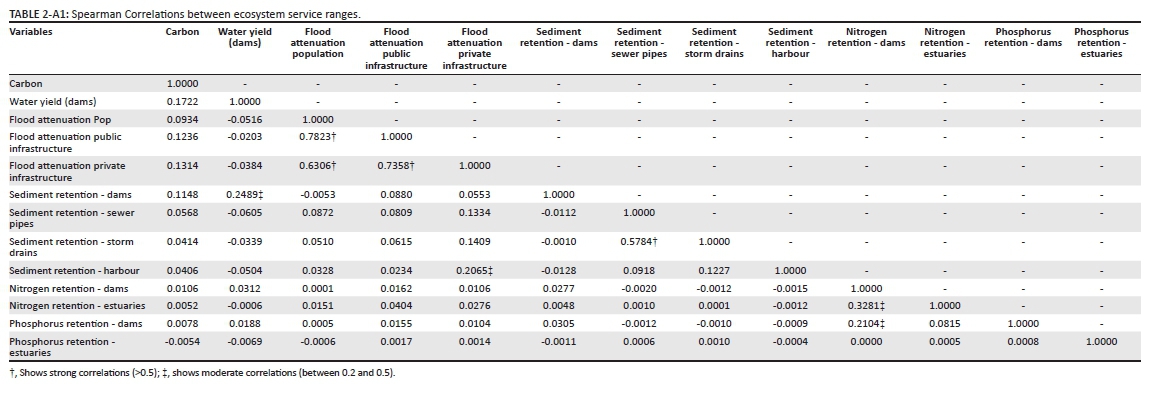
Ecosystem services are not necessarily correlated with each other. For ecosystem service ranges, out of 78 possible combinations, only five showed a moderate correlation (between 0.2 and 0.5) and four showed a strong correlation (> 0.5) (Table 2-A1). The three flood attenuation services, i.e. for public infrastructure, private property and population protection, all had strong positive correlations with each other, with the highest correlations between services in this group. A strong positive correlation was also found between sediment retention services important to prevent clogging of storm drains and sedimentation to sewer pipes. Moderate correlations were found between carbon storage and water yield to dams. Water yield to dams also showed a moderate correlation with the sediment retention service to dams. Similarly, nitrogen retention service relative to dams also showed moderate positive correlations with phosphorus retention to dams and nitrogen retention to estuaries.
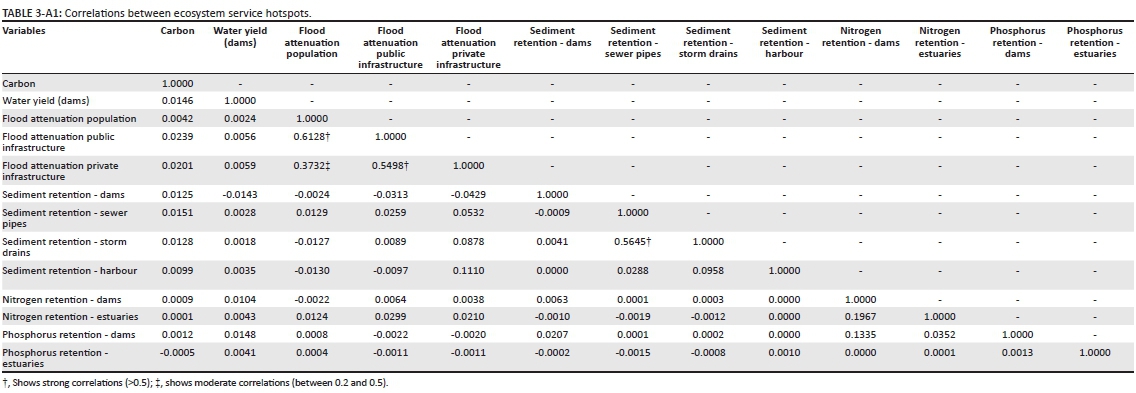
Correlations between ecosystem service hotspots were lower than those between ecosystem services ranges. Out of 78 possible combinations, only two combinations were moderately correlated (between 0.2 and 0.5) and three had strong correlations (> 0.5). Similar to the ranges, the sediment retention service hotspots showed moderate to strong correlations with each other (Table 3-A1). Nitrogen retention to dams also showed a moderate correlation with nitrogen retention to estuaries. This highlights that a combination of different areas are required to maintain the whole suite of ecosystem services.
Correlations between ecosystem service hotspots and critical biodiversity and conservation areas
The study identified positive correlations between the majority of the ecosystem services assessed and terrestrial critical biodiversity areas. Water yield to dams had the highest correlation with terrestrial critical biodiversity areas, followed by carbon storage and flood attenuation relevant to public infrastructure (Table 4-A1). Whilst overlap analyses indicated that terrestrial critical biodiversity areas generally contribute significantly to all ecosystem service hotspots, correlation analysis on average indicated weak correlations with all services, with weak negative correlations with sediment and phosphorus retention to dams (Table 4-A1). Whilst positive correlations generally imply that ecosystem service values increase with biodiversity values, given the weakness of the correlations, certain areas with high ecosystem service values, for the services assessed in this study, may not necessarily also have high biodiversity values and vice versa.
Whilst the percentage overlap of certain ecosystem service hotspots with critical biodiversity areas and conservation areas may seem negligible, when translated into area, large pieces of land significant for both critical biodiversity and ecosystem service hotspots are available for selection to be managed to satisfy the conservation objectives of both. For example, the lowest percentage overlap of a hotspot with terrestrial critical biodiversity areas was water yield service at 6%, amounting to approximately 7000 ha with high ecosystem service and biodiversity values.
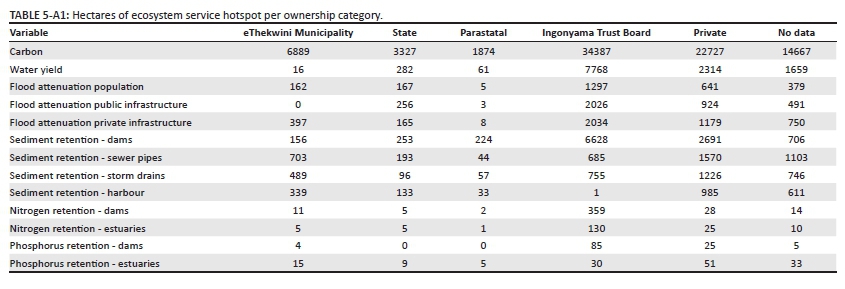
Ecosystem service hotspots ownership
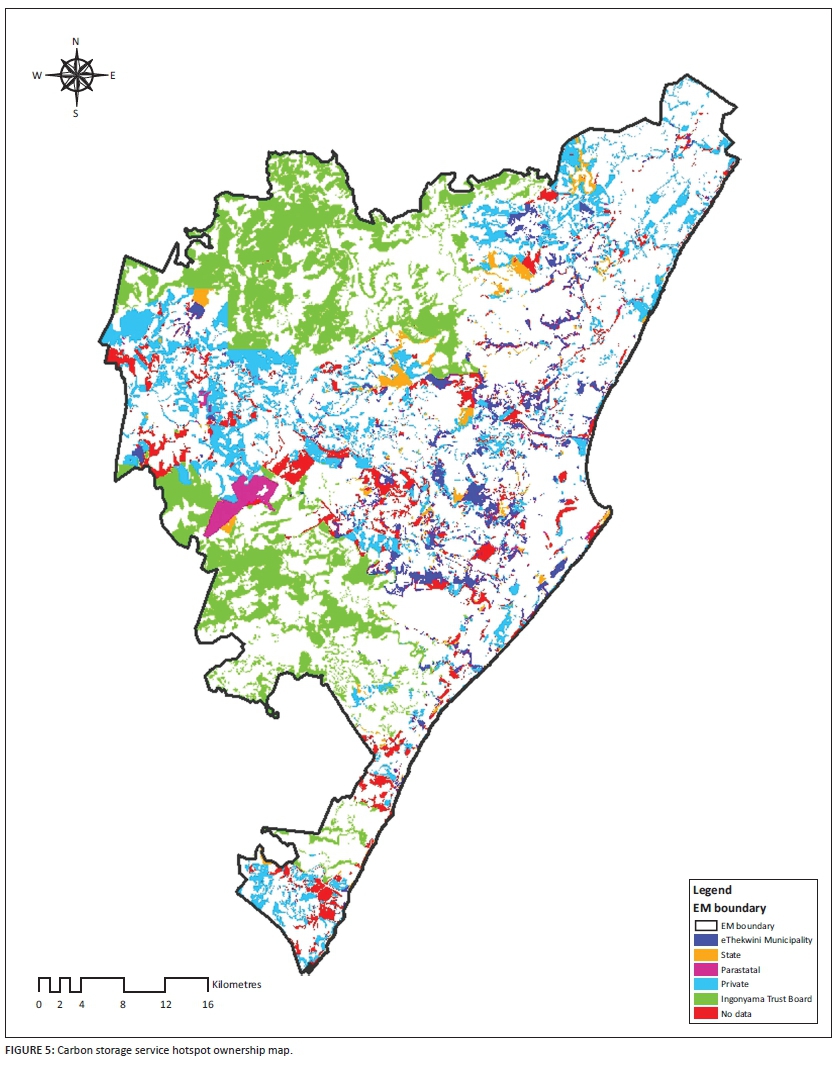
On average, the majority of the ecosystem service hotspot areas either fall within the ITB land (44%) or on privately owned land (27%). This is followed by eThekwini Municipality administered land (7%) and state land (4%), with parastatal ownership constituting only 2% (Table 2, Figure 4, Table 5-A1). No ownership data were available for the remaining 17% of ecosystem service hotspot areas.

Significant proportions of nine ecosystem services hotspots occurred within ITB areas (between 41% and 86% of their area, Table 2, Table 5-A1). Amongst these, nitrogen retention to dams and estuaries (86% and 74% respectively), phosphorus retention to dams (72%) and water yield (64%) were significant. Moderate percentages (between 22% and 29%, Table 2, Table 5-A1) of four ecosystem service hotspots fall within areas for which ownership information was not available. As an example, Figure 5 shows the ownership distribution for the carbon storage hotspots.
The balance of the majority of ecosystem services was contained within private ownership (between 21% and 47%). Ecosystem service hotspots were generally poorly represented within municipal and state ownership categories, except for three sediment retention hotspots (sewer pipe, storm drains and harbour) of which between 15% and 16% are administered by the municipality.
Discussion
The novel mapping approach used to produce the 13 original ecosystem service layers has certain limitations. For example, InVEST models do not explicitly consider surface-groundwater interactions or impacts of inter and intra annual variability, and some data are not locally calibrated, thereby limiting the exact quantification of services (Glenday 2012). However, the availability of these ecosystem service layers offered a unique opportunity to spatially analyse certain ecosystem services in Durban for the first time. This study is seen as an important step towards identifying potential management synergies between ecosystem services and biodiversity, and identifying strategies towards protecting ecosystem services in an urban context.
There are a number of factors that limit the effective management of ecosystem services in Durban. The vast majority of important ecosystem service areas are located outside of managed conservation areas and within communal lands that are currently under joint ITB and municipal administration (eThekwini Municipality 2012b), facing threats of habitat transformation, invasive alien plant invasions, rapid densification and pollution. Additionally, the generally weak correlations between ecosystem services included in this study and terrestrial critical biodiversity areas indicate that there is limited potential for the selection of areas supplying high levels of both ecosystem services and biodiversity. This finding highlights that more land may be required to conserve and manage both ecosystem services and biodiversity. In an urban context such as Durban, this is at the same time critically important and challenging.
The fact that the study found weak correlations between ecosystem services and that less than 5% of the total hotspot provisioning areas supply three or more ecosystem services may indicate that these services require separate considerations in conservation assessments (Egoh 2009) and may also limit the selection of areas that supply multiple services for management. However, this may only be true in light of the ecosystem services assessed in this study. The inclusion of additional ecosystem services, e.g. cultural and recreational services, may provide for greater selection of areas that supply multiple services for management.
For the management of ecosystem services and biodiversity to be successful, a multidisciplinary approach that involves all stakeholders is needed (Cowling et al. 2008). Varying ecological and social contexts may require different institutional mechanisms to protect ecosystem services, depending on locally based information. Thus, in the context of Durban, strategies for the protection of hotspots may even differ between the various ownership categories given the differences in their institutional structures. Furthermore, those ecosystem service hotspots for which ownership information was not available would also need to be considered as a lack of ownership information will hinder the formation of management partnerships.
Despite these challenges, there are numerous opportunities to enhance ecosystem service protection and management in the urban context. Where biodiversity priority areas overlap with important ecosystem service provisioning areas, conservation strategies aimed at biodiversity will safeguard ecosystem services (Egoh 2009) and those ecosystem services can be used as additional justification for biodiversity conservation.
Given the limited availability of human and financial resources for conservation and management, the small percentages of areas providing numerous ecosystem service hotspots - e.g. approximately 550 ha supplying five service hotspots (Figure 2) - do, however, allow for easy selection of areas where management efforts could yield greater benefits. In addition, overlap analyses of these 550 ha with critical biodiversity areas and D'MOSS would allow for the further refinement of areas to be prioritised for management where greater returns on management investments could be achieved.
Based on the findings that about a third of ecosystem services provisioning areas overlap with terrestrial critical biodiversity areas in Durban, there are numerous opportunities for the co-management of these areas. This is in line with the findings of a number of studies that indicated a direct relationship between ecosystem services and biodiversity (Chan et al. 2006; Egoh 2009; Singh 2002; Turner et al. 2007). However, based on the findings of this study that shows that ecosystem services can exist even in areas with low biodiversity and that ecosystem services cannot be fully accommodated in existing conservation areas and critical biodiversity areas, this justification cannot be used in all cases.
These findings highlight the need for an independent conservation strategy for ecosystem services in Durban which is complementary to biodiversity conservation. This strategy could include measures to ensure that ecosystem services are given consideration either through protected area expansion, in assessing development applications, through appropriate zoning, acquisition by management authorities and by implementing stewardship programmes in communally or privately owned areas. For co-management of ecosystem services and biodiversity, a prioritisation process may be required depending on the aim of management, to either select areas with high ecosystem service values and some biodiversity values, or high biodiversity values with some ecosystem service values. In addition, to safeguard ecosystem service hotspots lying outside of conservation areas and existing DMOSS, an ecosystem service management and protection strategy should, at least, also include the prioritisation of the 550 ha that have a hotspot richness of five or more and also consider the threats services face, as is the case for biodiversity where critically endangered features are given priority (Balvanera et al. 2001; Sisk et al. 1994).
Conclusion
The study identified win-win opportunities to co-manage ecosystem service hotspots and critical biodiversity and conservation areas and opportunities to manage areas supplying numerous ecosystem services. However, whilst these areas allow for easy prioritisation for greater returns on investment, the challenge lies in managing and protecting the large proportion of critical ecosystem service provisioning areas that are vulnerable to transformation outside of these managed areas. This raises the importance of establishing a link between planning and action that would incorporate priority ecosystem service areas within the municipal decision-making framework. This includes the identification of an ecosystem service management and protection strategy that facilitates the selection of ecosystem service priority areas for management and as locations for engagement with communal and private landowners through biodiversity stewardship; using ecosystem service hotspots as triggers for development assessment and approval processes; and the co-management of areas supplying both critical biodiversity and ecosystem services.
Acknowledgements
We thank the eThekwini Municipality Environmental Planning and Climate Protection Department for their support and for providing the foundational data for this research. This study was supported by eThekwini Municipality through the Durban Research Action Partnership: KwaZulu-Natal Sandstone Sourveld Programme. The South African Research Chairs Initiative of the Department of Science and Technology and the National Research Foundation of South Africa (grant no 84157) financially supported the research.
Competing interests
The authors declare that they have no financial or personal relationships which may have inappropriately influenced them in writing this article.
Authors' contributions
The lead author, R.D., conceptualised the study, performed all analyses and led the writing of the manuscript. All other authors contributed to the writing and commented on several drafts.
References
Balvanera, P., Pfisterer, A.B., Buchmann, N., Nakashizuka, T., Raffaelli, D. & Schmid, B., 2006, 'Quantifying the evidence for biodiversity effects on ecosystem functioning and services', Ecology Letters 9, 1146-1156. http://dx.doi.org/10.1111/j.1461-0248.2006.00963.x [ Links ]
Chan, K.M., Shaw, M.R., Cameron, D.R., Underwood, E.C. & Daily, G.C., 2006, 'Conservation planning for ecosystem services', PLoS Biology 4, e379. [ Links ]
Convention on Biological Diversity (CBD), 2010, The convention on biological diversity, in Proceedings of the 10th meeting of the Conference of Parties (COP10): Decision X/2 on Strategic Plan for Biodiversity 2011-2020, viewed 8 December 2013, from https://www.cbd.int/decision/cop/id=12268 [ Links ]
Costanza, R., de Groot, R., Sutton, P., van der Ploeg, S., Anderson, S.J., Kubiszewski, I. et al., 2014, 'Changes in the global value of ecosystem services', Global Environmental Change 26, 152-158. http://dx.doi.org/10.1016/j.gloenvcha.2014.04.002 [ Links ]
Cowling, R.M., Egoh, B., Knight, A.T., O'Farrell, P.J., Reyers, B., Rouget, M. et al., 2008, 'An operational model for mainstreaming ecosystem services for implementation', PNAS, 105(28), 9483-9488, http://dx.doi.org/10.4102/10.1073/pnas.0706559105 [ Links ]
Daily, G.C., Polasky, S., Goldstein, J., Kareiva, P.M., Mooney, H.A., Pejchar, L. et al., 2009, 'Ecosystem services in decision making: Time to deliver', Frontiers in Ecology and the Environment 7(1), 21-28. http://dx.doi.org/10.1890/080025 [ Links ]
Diaz, S., Tilman, D., Fargione, J., Chapin, F.S. III, Dirzo, R. & Ktzberber, T., 2005, 'Biodiversity regulation of ecosystem services', in Millenium Assessment, Ceballos, G., Lavorel, S., Orians, G., Pacala, S., Supriatna, J., (ed.), Trends and conditions, pp. 279-329, Island Press, Washington, DC. [ Links ]
Dixon W.J., 1953, 'Processing data for outliers', International Biometric Society Stable 9(1), 74-89. [ Links ]
Dube, T.B., 2011, 'An analysis of alternative funding strategies for protected area management: A case study of Ezemvelo KZN Wildlife', viewed 10 August 2013, from http://hdl.handle.net/10019.1/18194 [ Links ]
Egoh, B., Reyers, B., Rouget, M., Bode, M. & Richardson, D.M., 2009, 'Spatial congruence between biodiversity and ecosystem services in South Africa', Biological Conservation 142, 553-562. http://dx.doi.org/10.1016/j.biocon.2008.11.009 [ Links ]
Escobedo F.J., Kroeger, T. & Wagner, J.E., 2011, 'Urban forests and pollution mitigation: Analyzing ecosystem services and disservices', Environmental Pollution 159(2011), 2078-2087. [ Links ]
eThekwini Municipality, 2011a, The role of biodiversity impact assessment in protecting ecosystems, viewed 10 August 2013, from http://www.durban.gov.za/City_Services/development_planning_management/ environmental_planning_climate_protection/Biodiversity _Impact_Assessment/Pages/The-role-of-biodiversity-impact-assessment-in-protecting-D'MOSS.aspx [ Links ]
eThekwini Municipality, 2012a, State of biodiversity report 2011/2012, Department of Environmental Planning and Climate Protection, Durban, viewed 10 June 2013, from http://www.durban.gov.za/City_Services/development_planning _management/environmental_plannin g_climate_protection/Publications/Documents/ State_of_Biodiversity_Report_2011_2012.pdf [ Links ]
eThekwini Municipality, 2012b, Draft systematic conservation plan 2012, Department of Environmental Planning and Climate Protection, Durban. [ Links ]
eThekwini Municipality, 2013a, State of biodiversity report 2012/2013, Department of Environmental Planning and Climate Protection, Durban, viewed 10 August 2013, from http://www.durban.gov.za/City_Services/development_planning_management/ environmental_planning_climate_protection/Publications/ Documents/Durban_SOB_2012_2013_low_res.pdf [ Links ]
eThekwini Municipality, 2014, eThekwini biodiversity stewardship programme, viewed 15 August 2014, from http://www.durban.gov.za/City_Services/development_planning_management/environmenta l_planning_climate_protection/Projects/Pages/eThekwini-Biodiversity-Stewardship-Programme.aspx [ Links ]
eThekwini Municipality, 2015, State of biodiversity report 2014/2015, Department of Environmental Planning and Climate Protection, Durban, viewed 12 September 2015, from http://www.durban.gov.za/City_Services/development_planning_management/environmental _planning_climate_protection/Publications/Documents/ BiodiversityReport1415_Content.Compressed.pdf [ Links ]
Glenday, G., 2012, Mapping ecosystem services in the eThekwini municipal area using InVEST and GIS analysis, unpublished document, Department of Environmental Planning and Climate Protection, eThekwini Municipality, Durban. [ Links ]
Goldman, R.L., Tallis, H., Kareiva, P. & Daily, G.C., 2008, 'Field evidence that ecosystem service projects support biodiversity and diversify options', Proceedings of the National Academy of Sciences 105(2008), 9445-9448. http://dx.doi.org/10.1073/pnas.0800208105 [ Links ]
Ingonyama Trust Board, 2012, Ingonyama Trust Board [Online], [ Links ] URL: http://www.ingonyamatrust.org.za/web/about/
IPCC (Intergovernmental Panel on Climate Change), 2012, 'Managing the risks of extreme events and disasters to advance climate change adaptation', in C.B. Field et al. (eds.), A special report of Working Groups I and II of the IPCC, Cambridge University Press, Cambridge, UK. [ Links ]
IPCC, 2013, Climate change 2013: The physical science basis, in L. Alexander et al. (eds.), Summary for policymakers, IPCC Secretariat, Geneva, Switzerland. [ Links ]
Jantz, C.A. & Manuel, J.J, 2013, 'Estimating impacts of population growth and land use policy on ecosystem services: A community-level case study in Virginia, USA', Ecosystem Services 5, 110-123. [ Links ]
Kumar, P. & Martinez-Alier, J., 2011, 'The economics of ecosystem services and biodiversity: An international assessment', Economic & Political Weekly XLVI(24), viewed 12 September 2013, from http://www.ieep.eu/assets/807/TEEB_in_EPW_2_.pdf [ Links ]
Laurans, Y., Rankovic, A., Billé, R., Pirard, R. & Mermet, L., 2013, 'Use of ecosystem services economic valuation for decision making: Questioning a literature blindspot', Journal of Environmental Management 119, 208-219. http://dx.doi.org/10.1016/j.jenvman.2013.01.008 [ Links ]
Lyytimäki, J. & Sipilä M, 2009, 'Hopping on one leg - The challenge of ecosystem disservices for urban green management', Urban Forestry & Urban Greening 8(2009), 309-315. http://dx.doi.org/10.1016/j.ufug.2009.09.003 [ Links ]
McGranahan, G., Marcotullio, P., Bai, X., Balk, D., Braga, T., Douglas, I. et al., 2005, 'Ecosystems and human well-being', Vol. 1, in Current state and trends, Chapter 27, Urban Systems. Island Press, Washington, DC. ISBN 1-55963-227-5. [ Links ]
Millennium Ecosystem Assessment (MEA), 2005, Ecosystems and human well-being: Synthesis report, Island Press, Washington, DC. [ Links ]
Munang, R.T., Thiaw, I. & Rivington, M., 2011, 'Ecosystem management: Tomorrow's approach to enhancing food security under a changing climate', Sustainability, 3(7), 937-954. [ Links ]
Myers, N., 1988, 'Threatened biotas: "Hot spots" in tropical forests', The Environmentalist 8(3), 187-208. [ Links ]
Naidoo, R. & Adamowicz, W.L., 2005, 'Economic benefits of biodiversity exceed costs of conservation at an African rainforest reserve', Proceedings of the National Academy of Sciences United States of America 102, 16712-16716. http://dx.doi.org/10.1073/pnas.0508036102 [ Links ]
Naidoo, R. & Ricketts, T.H., 2006, 'Mapping the economic costs and benefits of conservation', PLoS Biology 4, e360. [ Links ]
Orme, C.D.L., Davies, R.G., Burgess, M., Eigenbrod, F., Pickup, N., Olson, V.A. et al., 2005, 'Global hotspots of species richness are not congruent with endemism or threat', Nature 436, 1016-1019. http://dx.doi.org/10.1038/nature03850 [ Links ]
Pan, Y., Xu, Z. & Wu, J., 2013, 'Spatial differences of the supply of multiple ecosystem services and the environmental and land use factors affecting them', Ecosystem Services 5, 4-10. http://dx.doi.org/10.1016/j.ecoser.2013.06.002 [ Links ]
Prendergast, J.R., Quinn, R.M., Lawton, J.H., Eversham, B.C. & Gibbons, D.W., 1993, 'Rare species, the coincidence of diversity hotspots and conservation strategies', Nature 356, s335-s337. http://dx.doi.org/10.1038/365335a0 [ Links ]
Press, W.H., Flannery, B.P., Teukolsky, S.A. & Vetterling, W.T., 1992, Numerical recipes in FORTRAN: The art of scientific computing, 2nd edn., Cambridge University Press, Cambridge, England, p. 694. [ Links ]
Republic of South Africa (RSA), 2004, No. 10 of 2004: National Environmental Management: Biodiversity Act, 2004, Government Gazette, Vol. 467, 7 June 2004, No. 26436, Cape Town. [ Links ]
Roberts, D., 1994, 'The design of an urban open-space network for the city of Durban (South Africa)', Environmental Conservation 21(1), 11-17. http://dx.doi.org/10.1017/S0376892900024024 [ Links ]
Roberts, D. & O'Donoghue, S., 2013, 'Urban environmental challenges and climate change action in Durban, South Africa', Environment and Urbanization 25, 299-319. http://dx.doi.org/10.1177/0956247813500904 [ Links ]
Ruckelshaus, M., Mckenzie, E., Tallis, H., Guerry, A., Daily, G., Kareiva, P. et al. 2015, 'Notes from the field: Lessons learned from using ecosystem service approaches to inform real-world decisions', Ecological Economics 115, 11-21. http://doi.org/10.1016/j.ecolecon.2013.07.009 [ Links ]
Singh, S.P., 2002, 'Balancing the approaches of environmental conservation by considering ecosystem services as well as biodiversity', Current Science 82(11), 1331-1335. [ Links ]
Sisk T.D, Launer, A.E., Switky, K.R., & Ehrlich, P.R., 1994, Identifying extinction threats: global analyses of the distribution of biodiversity and the expansion of the human enterprise, Bioscience 44, 592-604. [ Links ]
South African Department of Environmental Affairs (DEA), 2011, National strategy for sustainable development and action plan (NSSD 1) 2011-2014, viewed 15 September 2015, from https://www.environment.gov.za/sites/default/files/ docs/sustainabledevelopment_actionplan_strategy.pdf [ Links ]
Sim, V., Sutherland, C. & Scott, D., 2016, 'Pushing the boundaries - Urban Edge challenges in eThekwini Municipality', South African Geographical Journal 98(1), 37-60. http://dx.doi.org/10.1080/03736245.2015.1052840 [ Links ]
Steffen, W., Richardson, K., Rockstrom, J., Cornell, S.E., Fetzer, I., Bennett, E.M. et al., 2015, 'Planetary boundaries: Guiding human development on a changing planet', Science 347(6223), 1259855. http://dx.doi.org/10.1126/science.1259855 [ Links ]
Steffen, W., Sanderson, A., Tyson P.D., Jäger, J., Matson P.A., Moore III, B. et al. 2004, Global change and the earth system: A planet under pressure, The IGBP Book Series, Springer-Verlag, Berlin. [ Links ]
Sutherland, C., Hordijk, M., Lewis, B., Meyer, C. & Buthelezi, B., 2014, 'Water and sanitation delivery in eThekwini Municipality: A spatially differentiated approach', Environment & Urbanisation 26(2), 469-488. http://dx.doi.org/10.1177/0956247814544871 [ Links ]
TEEB Foundations, 2010, The economics of ecosystems and biodiversity: Ecological and economic foundations', Earthscan, London. [ Links ]
The Intergovernmental Science-Policy Platform on Biodiversity and Ecosystem Services (IPBES), 2012, 'Functions, operating principles and institutional arrangements of ecosystem services', adopted by the Second Session of the Plenary Meeting to Determine the Modalities and Institutional Arrangements for IPBES, in Panama City, Panama, April 16-21, 2012, viewed 16 September 2015, available from http://www.ipbes.net/images/Functions%20operating%20principles%20and %20institutional%20arrangements%20of%20IPBES_2012.pdf [ Links ]
Turner, W.R., Brandon, K., Brooks, T.M., Costanza, R., Da Fonseca, G.A.B. & Portela, R., 2007, 'Global conservation of biodiversity and ecosystem services', BioScience 57(10), 868-873. http://dx.doi.org/10.1641/B571009 [ Links ]
United Nations, Department of Economic and Social Affairs (UN DESA), Population Division, 2015, World population prospects: The 2015 revision, New York. [ Links ]
van Jaarsveld, A.S., Freitag, S., Chown, S.L., Muller, C., Koch, S., Hull, H. et al., 1998, 'Biodiversity assessment and conservation strategies', Science 279, 2106-2108. [ Links ]
von Döhren, P. & Haase, D., 2015, 'Ecosystem disservices research: A review of the state of the art with a focus on cities', Ecological Indicators 52(2015), 490-497. http://dx.doi.org/10.1016/j.ecolind.2014.12.027 [ Links ]
Willemen, L., Drakou, E.G., Dunbar, M.B., Mayaux, P. & Egoh, B.N., 2013, 'Safeguarding ecosystem services and livelihoods: Understanding the impact of conservation strategies on benefit flows to society', Ecosystem Services 4(2013), 95-103. http://dx.doi.org/10.1016/j.ecoser.2013.02.004 [ Links ]
 Correspondence:
Rashieda Davids
rashieda@enviroheart.co.za
Received: 05 June 2016
Accepted: 04 Oct. 2016
Published: 05 Dec. 2016
1 Through the Municipal Property Rates Act 2004, these areas obtain additional services (e.g. invasive alien plant control, fire management and pollution monitoring) for an additional property tax paid by landowners.
Appendix 1
Supporting Material

