


Services on Demand
Journal

Article
 English (pdf)
 Article in xml format
 Article references
 Send this article by e-mail
Indicators
Related links
-
 Cited by Google
 -
 Similars in Google
Share

 Permalink
South African Journal of Occupational Therapy
On-line version ISSN 2310-3833Print version ISSN 0038-2337
S. Afr. j. occup. ther. vol.44 n.3 Pretoria Dec. 2014
SCIENTIFIC ARTICLES
Livelihoods of youths with and without disabilities in peri-urban South Africa
Fasloen AdamsI; Patricia de WittII; Denise FranzsenIII; Patrick MasekoIV; Theresa LorenzoV
IB Sc OT (Stellenbosch), MSc OT (UCT) Lecturer, Dept of Occupational Therapy, School of Therapeutic Sciences, Faculty of Health Sciences, University of the Witwatersrand
IIDOT (Pretoria), MSc OT (Wits) Adjunct Professor, Head of Department of Occupational Therapy, School of Therapeutic Sciences, University of the Witwatersrand
IIIBSc OT (Wits), MSc OT (Wits) DHT (Pret) Senior Lecturer, Dept of Occupational Therapy, School of Therapeutic Sciences, University of the Witwatersrand
IVManager, Bona Lesedi Disability Project, Diepsloot, Johannesburg
VBSc OT (Wits), MSc (University of London), PhD (UCT) Associate Professor and Programme convenor for Disability Studies Postgraduate Programmes, School of Health and Rehabilitation Sciences, Faculty of Health Sciences, University of Cape Town
ABSTRACT
South Africa has good legislation advocating for the rights of youth with disabilities although consistent implementation remains problematic. In order to inform policy implementation barriers and opportunities must be identified within each unique context and how these influence the ability of youth with disabilities to sustain their livelihood. This study aimed to investigate the human and financial assets of youth with disabilities living in the disadvantaged communities of Diepsloot and Cosmo City compared to their non-disabled counterparts. The study used a cross-sectional survey design using snowball sampling to identify 189 participants. This study found that the majority of the youth, whether they had a disability or not, had difficulties sustaining their livelihoods particularly the participants with disabilities who had a lower level of education and fewer employment opportunities. Youth with disabilities were financially more stable than their non-disabled counterparts due to their ability to access disability grants.
Key words: livelihoods, youth with disabilities, human assets, financial assets
INTRODUCTION
The responsibility for the maintenance of health and wellbeing is placed on both the individual and the context in which they live1.
However individuals seldom have control over a variety of factors in their environment, such as poverty and low levels of education which can negatively influence their health and wellbeing.
An adequate physical environment, including access to safe water, clean air, health services, healthy workplaces, safe houses and good roads, have also been shown to contribute to health. In addition work opportunities and social support networks within a community contribute to wellbeing, particularly if there is support from families, friends and communities. Finally, culture, customs, traditions and the beliefs of the family and community about illness, health practices and disability, all affect wellbeing and health outcomes2.
In recognition of the role the contextual factors play in the health and wellbeing the General Assembly of the United Nations (UN) adopted the Millennium Declaration in 20003. In this declaration, persons with disabilities were overlooked. Only recently it has been recognised that the social, cultural and economic constraints disabled people face are not necessarily part of living with an impairment4. This social view of disability considers the right to health care, education and social participation for persons with disabilities and was formalised in the UN Convention on the Rights of People with Disability5. Disability can be exacerbated by poverty as households which include persons with disabilities may have fewer resources, support networks and are poorer than those not affected by disability6.
As occupational therapists are well aware that persons with disabilities living in disadvantaged communities rarely experience adequate health or wellbeing, they are well placed to play a role in the achievement and implementation of the African Decade of Persons with Disabilities objectives7. Occupational therapists can implement programmes to address occupational risk factors which include occupational deprivation, alienation, imbalance8 injustice and insufficiency9. This can be achieved by taking into account, the barriers and opportunities within each unique context and how these influence the ability of persons with disabilities to sustain their livelihoods10.
There is, however, limited information about the sustainable livelihoods of persons with disabilities in disadvantaged communities in South Africa. This paper reports on a collaborative research project that investigated the livelihoods of youth with disabilities. The research was carried out by a team of occupational therapists from six universities and community based rehabilitation workers (CRWs) in 10 different sites in South Africa, including the two sites reported on in this paper.
The aim of the study was to understand how South African youth with and without disabilities, living in the same disadvantaged communities, used strategies to create and/or access opportunities for participation in occupations that sustained their livelihoods. Thus the study was grounded in the Sustainable Livelihood Framework11. Within this framework, a livelihood consists of capabilities or assets divided into human, natural, financial, physical and social capitals, representing environmental and personal resources, which are used with activities to achieve livelihood outcomes. (Figure 1). In this study only the human and financial capitals or assets were investigated.

The context in which persons carry out their livelihoods, as well as policies and legislation, may also affect the persons' assets11.
A livelihood is sustainable when it allows for the maintenance or enhancement of current capabilities and assets. The implication is that there cannot be any livelihoods if persons with disabilities have no capabilities and too few resources. Thus to sustain their livelihoods persons with disabilities must have the capacity to overcome their adverse circumstances supported by a stable environment that presents opportunities and resources11. Enabling policies and processes need to make this possible. The Sustainable Livelihood Framework was designed to evaluate under-resourced communities and was therefore used in the evaluation carried out at the two sites discussed in this paper.
CONTEXTS OF THE STUDY
The two sites were similar disadvantaged peri-urban communities, namely Diepsloot and Cosmo City, bordering the city of Johannesburg. Both were established soon after the first democratic elections in 1994.
Diepsloot
Diepsloot developed in 1995 as a transit camp for people transitioning from the informal settlements in Honeydew and Alexandra. This was a township of shacks until 1999 when formal low cost housing was built. Today Diepsloot is a sprawling settlement of approximately 200,000 people in an area of just 8.58km2 north of Johannesburg12,13.
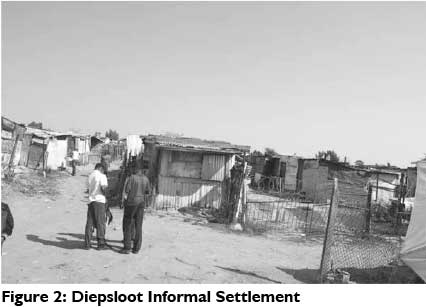
Diepsloot consists of 13 formal and informal extensions. Housing includes bonded and Reconstruction and Development Programme (RDP) houses (a generic South African term for state-subsidised houses) which have access to water, electricity and sanitation facilities on their stands. However, it is in the informal extensions where more than 50% of people live, mainly in 3m-by-2m shacks. In this informal section, there are no basic services on the individual stands (Figure 2). Communal toilets and water points are available intermittently and residents use paraffin stoves and wood fires for cooking14.
Diepsloot is mainly a South African black African neighbourhood but there are also many foreign nationals living there. More than half the population is thought to be unemployed partly due to being far from an economic hub. It is estimated that 9519 households have no annual income. At present public transport is by means of minibus- taxis and a lack of other transport limits access to the workplace14.
There are churches of many denominations which provide religious and other support to the community. There are three primary schools, one high school and two combined schools, as well as a youth skills training centre. There are no schools for learners with special needs. Public health facilities consist of two community health centres and the nearest public hospital is 40 kilometres away13. There are many projects and organisations that cater for the needs of persons with disabilities, providing support and home based carers, however there is the only one project that provides rehabilitation services, including occupational therapy and physiotherapy services.
Cosmo City
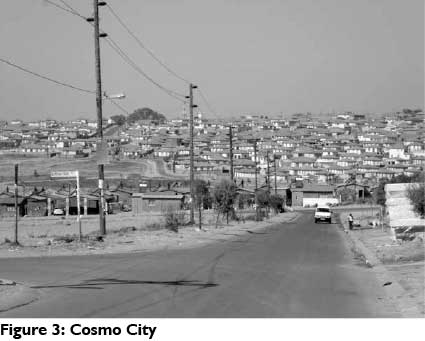
Cosmo City, a mixed income settlement, was developed in 2006 and is in the same municipal district as Diepsloot. It was developed through a government-private partnership and it has 5000 low cost units, 3000 RDP units, 1 000 apartments for rent and 3300 bonded houses. There is an estimated population of 50 00015 and all the stands are fully serviced with water, sanitation and electricity (Figure 3).
Those liuving in the RDP houses are mostly black Africans who were moved from nearby informal settlements which offered limited access to basic services16.
Many of the inhabitants operate businesses from their homes. Cosmo City is well positioned to nearby affluent communities and the economic hub in northern Johannesburg17. Like Diepsloot, the only public transport is the mini-bus taxi service.
Six schools have been completed, one of which is a technical school17. There is a community centre and a clinic in a container, which constitutes the available public health facilities. There is a private health centre for those who can afford it18. Thus residents have to travel to health centres in other areas or to the hospital 40 kilometres away. Some churches have been built. The only service specifically for persons with disabilities is an outreach service from Diepsloot and home based care.
DISABILITY RELATED LEGISLATION
Since the democratic elections in 1994, no research has established the situation in which youth with disabilities find themselves in comparison to youth without disabilities.
New legislation and polices facilitate the empowerment of persons with disabilities19 including the White Paper on an Integrated National Disability Strategy20 and the Employment Equity Act21. A policy on inclusive education was introduced in 2001 through the White Paper on Special Needs Education22, while the social development legislation provides free health care for all persons with disabilities and made a disability grant of R1 350 a month available to all persons with disabilities on a limited income. A child support grant of R320 a month for each child is also available to indigent parents, for children with disabilites, up to the age of 17 years23.
PURPOSE OF THE STUDY
Little is known about how youth with disabilities in disadvantaged communities sustain their livelihoods. Thus this project using the Sustainable Livelihood Framework was used to explore the sustainable livelihood strategies of youth with disabilities between the ages of 18 and 35 years living in Diepsloot and Cosmo City.
The objectives of this paper are to report on:
❖ the extent to which disability influences the human and financial assets of youth with and without disability living in disadvantaged communities.
❖ the influence the environment has on the human and financial assets of youth living in Diepsloot, compared to those living in Cosmo City.
METHODOLOGY
The research used a quantitative, descriptive, cross sectional survey design24 to compare the livelihood strategies of youth with and without disability24.
Snowball sampling was used to identify youth with disability25. Each person with a disability that agreed to participate was matched for age (within 5 years) with a youth with no disability that lived in a house nearby. The sample size was set at 50 disabled and 50 non-disabled participants per site. This sample size was based on recommendations of Bartlett, Kotrlik and Higgins26 and the 50 participants with disability from each of the two sites, made up a sample of 100 participants from the reported 1737 youth with disability living in this municipal ward27.
The first inclusion criterion was age. Although officially 'youth' in South Africa includes individuals 14-35 years of age28, this study only included participants between 18-35 years as parental consent was not required for participants over 18 years. The second inclusion criterion was 'disability' which includes hearing, seeing, physical, communication and mental impairments2.
The Research Instrument
As no research instrument could be found that met the specific requirements of the study a survey questionnaire was developed by the Disabled Youth Enabling Sustainable Livelihood (DYESL) team (this is the research group which was led by the Occupational Therapy Department and Disability Studies Postgraduate Programme at the University of Cape Town, and was the team responsible for the nation-wide project).
The questionnaire consisted of five sections related to the livelihood capitals of the Sustainable Livelihood Framework. Each section contained single-option and multiple-response items that addressed the human (education and health), social, financial, physical and natural assets of each participant11. The items in the questionnaire were based on qualitative data from a previous unpublished study, which identified the barriers and facilitators of youth with disability.
The questionnaire was developed during a research team workshop and was piloted on 15 disabled youth from a disadvantaged context, similar to the study sites, to determine content and construct validity. The inter-rater reliability was tested in five pilot studies following training of the fieldworkers in each research site. The questionnaire was finalised using the feedback in a second team workshop in 2009. The final version was piloted at a site in the Free State province of South Africa to confirm the inter-rater reliability.
Data collection
Semi structured interviews were used for data collection in each site by three field workers who were community rehabilitation workers and home-based carers from the non-governmental disability organisation - Bona Lesedi. The fieldworkers were trained by the DYESL team.
These field workers identified the youth that met the inclusion criteria and who agreed to participate. On completion of the interview, the participant was asked whether they knew any other youth with disability in the area. The data were collected over a period of one month.
Ethical approval
The research project was approved by the Human Research and Ethics Committees at the Universities of the Witwatersrand and Cape Town. Each potential participant was invited to participate.
The field workers explained the research to the participants from a standard information sheet and the participants signed informed consent. Confidentiality was maintained by using numerical codes for each questionnaire.
Data Analysis
The participants' demographics and their responses were analysed using frequencies and percentages. The statistical differences between the youth with and without disability, and between the two sites were established using chi squared tests. All statistical analyses were conducted using SPSS version 17.0.
This paper is limited to results of the human and financial capitals, with the other capitals being reported elswhere.
RESULTS
Demographics
A total of 185 questionnaires were included in the data analysis. This represented a sample of 93 youth with disability and 92 without disability. The small loss of 7.5% from the target number of 200 was due to incomplete questionnaires.
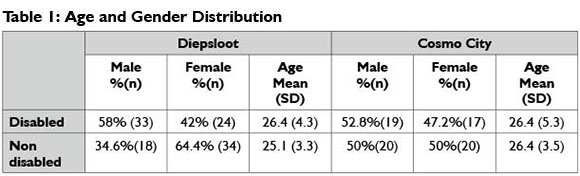
Statistical analysis indicated that the groups were comparable for gender although there were more male youth with disability and the female group without disability was larger. (Table 1). The groups were comparable for age at both sites with the mean age for disabled youth being 26.4 years and that of the non-disabled youth being 25.85 years.
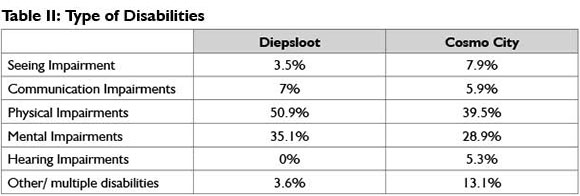
The most common impairment identified in both sites was physical impairment followed by mental impairments (Table II). In the Diepsloot cohort no youth with a hearing impairment were surveyed.
This study found that the majority of youth with disability reported being disabled either at birth or during childhood (69.75 %), with a smaller group becoming disabled as adults (30.25%).
Human capital
Within the Sustainable Livelihood Framework the human capital relates to education, health, knowledge and skills, capacity to work, nutrition and the capacity to adapt. This study did not examine the nutrition or capacity to adapt assets.
Education, Knowledge and Skills, and Capacity to Work
The participants attended school between 1982 and 2009. School attendance of 99% for youth without disability was higher than the 84.2 % reported in South Africa between 1998 and 200629. School completion for the entire group of 71.2% was also higher than the national average of 60% but their access to tertiary education (14.4%) was similar to the national average30. The percentage of youth with disability at both sites, who attended and completed school was significantly lower (p≤ 0.01) with only 76.2 % attending school and less than 42% completing school. No disabled participants accessed tertiary education.
Attendance at school and completion of schooling also differed in the two sites. As these sites are newly developed, all the participants living in Diepsloot would have started their primary school education in other places and those living in Cosmo City would have completed their schooling elsewhere.
In Diepsloot the access to school within the community for the youth with a disability resulted in better school attendance (p ≤ 0.01) compared to those now living in Cosmo City (Table 3). However, all participants living in Cosmo City, irrespective of whether they had a disability or not, had a better school completion rate than those living in Diepsloot.
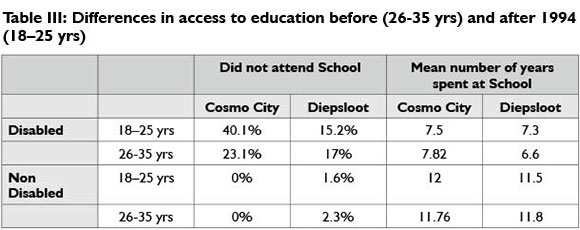
Those participants that were 26 years or younger completed their schooling after the election of the first democratice government (1994). This has made no difference to either the attendance or completion rate of school for youth without disability with most spending at least four years at high school.
For the youth with disability the change in constitution and education policies has not resulted in the expected change, with fewer participants, particularly those living in Cosmo City, having attended school since 1994. The mean number of years spent at school has also not improved, with most of the youth with disabilities only receiving a primary school education (Table III).
The time of onset of the disability affected the attendance at and completion of school, with those that became disabled as adults having attended school and completed at least three years of secondary school. Significantly fewer of the participants (42%) who reported the onset of disability at birth or during childhood attended school (p≤ 0.001) with the majority only attending primary school. The majority of participants with disability attended mainstream schools with only 6.5% attending special schools.
Although the most common reason reported by youth with disability for not attending school was 'family attitude', those that attended school prior to 1994 suggested finances rather than access as the primary constraint to school completion. Youth without disability gave the same reason for not completing school. Participants younger than 26 years reported physical access as the primary reason for not completing school as mainstream schools, even after 1994, were not adapted for those with disability.
Thus lack of resources and family attitude affected the educational assets of youth with disability, which are significantly less than those of their able- bodied counterparts, who have assets comparable to or better than average for South Africa. Some participants felt that it was not their lack of education, but rather their lack of skill that affected their employability. This was reported by 58.4% of youth without disability and 25.8% of youth with disability, particularly those who had become disabled in childhood and lived in Diepsloot.
Health Assets
The participants were asked to list the professionals who offered health care and psychological support in the community, as well as the frequency with which they were consulted. The list included the professionals known to offer services in the area. (See Table IV)
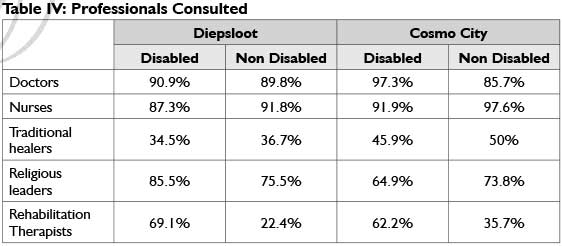
Doctors and nurses, working at the community health centres were the health professionals most commonly consulted by participants in both sites. As expected, youth with disability consulted rehabilitation professionals more frequently than youth without disability and access to these services were available in both communities.
There were very few services from social workers and psychologists to support the well-being of participants at clinics at either site. The services offered by religious leaders were used by participants for support and to help them to cope with their problems. Most services from religious leaders were offered in the community or at the homes of the participants. These services were well established in Diepsloot where youth with disability found this support valuable. This support was not as accessible in Cosmo City where churches were still being established, although youth without disability accessed these services outside their community.
Traditional healers practise at both sites but were consulted less frequently by those living in Diepsloot. Access and resources in terms of health care were available to the majority of those with disability, however they still reported health as the main reason they could not work.
Financial capital
The ability to work and generate an income relates to financial capital. Other than remunerated work, this includes grants as well as financial support from family and friends9.
Remuneration
The unemployment rate was high for participants with and without disability. Significantly more youths with disability were unemployed (89.9 %) compared to youth without disability (54.15%), which is considerably above the national average of 24.8%31. The employment rate for youth without disabilities living in Diepsloot (43%) was significantly lower than that for Cosmo City (65.3%) (p≤0.05). Only 38.7% of youths without disability appeared to receive remuneration for their work, with the rest being employed in the informal sector (which means inconsistent remuneration) or they were volunteers receiving a stipend.
The employed youths with disability did semi-skilled work in technical, clerical and craft related jobs, while the majority of the youths without disability worked in jobs classified as unskilled. Only 9.4% of the sample had attempted starting their own businesses. The most frequently reported problems within the work setting were unsupportive employers and lack of skills development. All of the youth without disability and 70% of those with disability reported that they were job seekers, indicating that the majority of both youth with and without disability and were keen to gain employment.
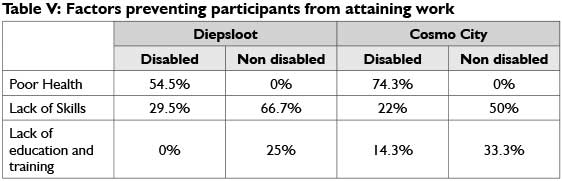
More of the participants with disability, living in Cosmo City (Table V) reported poor health as the most important factor preventing them from working.
Social Grants
As expected, significantly more (91%) of the youths with disabilities reported accessing a disability grant when compared to youths without disability (p≤ 0.001). These disability grants benefited the youth with disabilities as they were less likely than youths without disability to have parents who received an income, particularly if they were younger than 26 years.
Forty six percent of the youths without disabilities reported receiving child support grants, indicating they were parents themselves. None of the youth with disabilites received child support grants.
Family Support
While the study did not ascertain what financial support the participants received from their families, of the 84.35% of youth with disability who live with their parents or families, 41% of these families earned an income in the form of wages or a salary. Only 7.36% of the youths with disability had partners who were formally employed. Significantly less (34.3%) of participants without disability live with family (p≤ 0,01) and 37.23% lived with partners who are remunerated.
Those youth whose disability onset occurred in childhood, were more likely to have parents who had paid employment, particularly their mothers. Significantly more parents of youth without disability were employed (p≤0.05), particularly if they lived in Cosmo City. Since less than half the youths without disability and less than 10% of youths with disability were employed, their ability to sustain their livelihoods was compromised. The majority of the youths with disability received disability grants and nearly half of the youths without disability relied on childcare grants to supplement their income. Family support provided by parents or partners differ as the youths without disability were more likely to have a parent or a partner that received remuneration.
DISCUSSION
The loss of 7.5% of the participants was acceptable in terms of the validity of the study. The slightly larger sample of 39 participants surveyed in Diepsloot probably occurred due to the snowball sampling method and the familiarity of the fieldworkers with Diepsloot as this was where they were based. Since the outreach service in Cosmo City was recently developed, fieldworkers were not as familiar with persons with disabilities and the persons with disabilities may have been less aware of others with disabilities.
There were more males than females with disability which is consistent with the national and regional disability figures for the age group 18-35 years27. The prevalence of physical impairments in the sample was higher than the 29.65% reported in national statistics, while the prevalence of visual impairments was significantly lower than 32.1% nationally reported26. These results could be due to limitations of the fieldworker exposure, as the fieldworkers were more familiar with people who had physical and mental impairments than those with hearing and seeing impairments. Thus they could have been biased in the manner in which they recruited participants.
HUMAN CAPITAL
Education and health outcomes
The National Schools Act 84 of 199632 legislated mandatory attendance at school from age of 6 years to 16 years. However, this research found that access to schooling, while adequate for youths without disability was not being enforced for youths with disabilities. Additionaly the attendance at school for youths without disability was actually lower after 1994. The lack of the implementation of inclusive education legislated in 2001 is further supported by these results33. The fact that all those participants who became disabled after they completed school had access to schooling indicates that it is children with disabilities who face discrimination.
Finances were the most common reason that youths without disability did not complete school and this is in line with the reasons reported nationally34. It is of concern that the main reason reported by youths with disability for not attending school however was "family attitude". This is supported by Ford-Shubrook35 findings in other disadvantaged communities near Johannesburg, where schooling for children with disability was not started or was discontinued due to transport problems and family attitude. This may be attributed to a lack of awareness of the rights of persons with disabilities as well as the negative stigma and myths about disability36. In these impoverished communities parents are also more likely to invest money in the schooling of a child without disability as they may be more successful in finding employment. It is also more financially demanding to send a child with disability to school due to additional supervision and transport costs35.
While school attendance for those disabled youths now living in Cosmo City reflects the national average for black African youths with disabilities37, school attendance of disabled youths in Diepsloot was above the national average as mainstream primary schools in the community admit children with disability, although they do not have the resources to support these learners. The younger participants in Diepsloot also accessed schools in the site in which they live and those who attended school before moving to Diepsloot were living in established urban informal settlements close to Johannesburg.
The participants who moved to Cosmo City in 2006 were living in informal settlements which developed after 1994 with the influx from rural to urban areas due to abolishment of apartheid and influx contro138. Thus, participants probably had less access to school either because they lived in a rural area during their school years or in a poorly resourced informal settlement with no schools16.
The poor school completion rate reported in Diepsloot and Cosmo City for youth with disability occurred as they did not continue beyond a primary level of education, particularly in Diepsloot, where secondary school places are limited13. Youth with disability could not continue their secondary schooling at mainstream schools and the special schools in South Africa, which only accommodate about 20% of disabled learners39, often do not go further than primary education and are geographically far from the study sites.
The educational assets of youth with disability were found to be severely compromised in terms of the national standards, affecting their ability to access further training and develop skills that would make them employable. Even though policies which support inclusive education existed when the younger participants were at school, they were unable to access appropriate educational opportunities due to "family attitude" and lack of appropriate schools.
All participants utilised health and support services and had access to health professionals, which indicated that the policies providing free health care for the indigent and disabled appear to be effective. However youth with disability still perceive their health to be a problem even though approximately two thirds had also had contact with rehabilitation professionals.
The overcrowding of hospitals and clinics and poor quality of service reported for the public health services that these participants use40 thus brings into question the adequacy of the health services41 they access. It also needs to be considered that the youth with disability may view their health in relation to an internalised "sick role" encouraged by families to ensure they continue to receive a guaranteed income in the form of a disability grant.
Youths with disability in Diepsloot reported that religious establishments were a major source of support for them and that they receive acceptance and assistance from their churches. They consulted and relied on this service more than those in Cosmo City where these services have yet to be fully established. Although less than half the participants had consulted traditional healers, results indicated that participants were free to access health services according to their health beliefs.
FINANCIAL CAPITAL
Employment and financial support outcomes
The unemployment rate in both communities and in both cohorts was high, but it was significantly higher for the youth with disability. This higher unemployment rate was in line with the figure of 85% quoted for youth with disability in this age group nationally27.
The high unemployment rate of over 50% seen for youth without disability31 reflects globally the higher unemployment rate of youth42, although since data was only gathered on workdays (Monday to Friday), it is likely that the majority of employed youth may not have been available to be interviewed resulting in sampling bias.
For the cohort that was employed, disability or lack thereof played a role in the type of work participants engaged in. The majority without disability engaged in unskilled labour which in South Africa includes manual labour like construction work, gardening, cleaning or tasks related to lifting and carrying. It stands to reason that youths with physical disability would have difficulties in engaging in these tasks and that they were therefore excluded from these jobs and were engaged in semi-skilled or skilled work.
For the participants without disability that were unemployed, lack of skill was the most common reason for not being able to secure a job. Another factor was access to opportunities that would assist with finding employment, like access to tertiary education, family members that were employed who could give youth access to work openings43 and the proximity of the site in which they lived to the economic hub of Johannesburg. Those in Cosmo City were advantaged in all these opportunities compared to participants without disability in Diepsloot, resulting in a higher employment rate.
This study found that age of onset of disability did not impact on employability. Although those who became disabled as adults had completed their schooling they were no more able to secure employment than those who were disabled from childhood. This indicates that disability rather than education level has a greater effect on unemployment and that the Employment Equity Act has not been effectively implemented as yet, as only 0.8% of positions in the labour market are occupied by disabled persons44.
Although 91% of the youths with disability used a disability grant to sustain their livelihoods, research has shown that work and having a job is considered preferable to receiving a social grant and nearly three quarters of youths with disability in this study were interested in finding employment43.
It is not clear what financial support families provide for youths with disability, who are more likely to be living with parents. Since less than half these parents earned a formal income, the social grants received by the participants may be the only income for some families.
Youths without disability lived both with parents and partners, approximately 40% of whom, were remunerated. Nearly half the participants without disability, more of whom lived in Diepsloot, were registered as indigent parents and qualified to receive child care grants.
The reliance on grants as a strategy to sustain their livelihoods in both sites appears to be as a result of the inability of the participants to find remunerated work. Unemployed youths with disability had better financial assets than those without disability because of disability grants which literature shows can be helpful in facilitating job searches and setting up small enterprises43. Youths with disabilities still however would prefer to work than rely on a small disability grant.
LIVELIHOOD STRATEGIES
The vulnerability experienced by both youths with and without disabilities in terms of their human and financial assets was increased by a lack of a basic income due to poor education and unemployment. This makes it difficult for them to provide for their most basic needs for survival11. While access to grants may change the status of youths with disability from very poor to poor this has not moved them from poverty. Their other disadvantages, in terms of education, poor health and lack of mobility prevent them from moving up a step on the poverty scale as their chances for employment are very limited42. Youths with disability are further stressed by their inability to live separately from their parental family and their inability to assume adult responsibilities in their own families45.
While current legislation has helped create a new sense of awareness of the needs of disabled people and the formulation of policy under the new government has been excellent, the implementation of these policies remains a challenge. It has, therefore, had little impact on the ability of youth with disability from these two sites to meet desired outcomes in sustaining their livelihoods.
Limitations of the study
It is likely that the small sample and loss of 7.5% of participants may affect the external validity of these results. The snowballing sampling procedure has limitations in that individuals with all types of disability were not sourced at both sites and the method may not have been as effective in sampling those who are employed at both sites.
The research tool did not establish the impact of the disability on the participants' ability to learn per se, and if they were capable of completing all grades at school. The results demonstrated that some of the youths were disabled in adulthood. The fact that these participants may have completed school prior to becoming disabled may have inflated the figures for the youth with disability completing school compared to the national average36. Participants who became disabled as adults were also not asked about previous work experience.
CONCLUSION
This study intended to investigate the extent to which the human and financial assets of youth with disabilities living in the disadvantaged communities of Diepsloot and Cosmo City influence their livelihood strategies and outcomes when compared to those of their non-disabled counterparts.
This study found that the majority of the youths sampled, whether they had a disability or not, had difficulties sustaining their livelihoods. Contextual factors including the limited resources, limited finances, limited employment and skills development opportunities contributed to this. Due to access to disability grants, generally unemployed youth with disability were financially more stable than the unemployed youth without the disability.
However, this research also found that the youths with disability in these two sites accessed education opportunities less than their non-disable counterparts. This, in conjunction with poor family attitudes and their reported poor health makes it even more difficult for them to find employment to sustain their own livelihoods and that of their families. Although since 1994 South Africa has very good legislation in place to improve the conditions for persons with disabilities for this cohort of young people with disability, it has not significantly improved their ability to sustain their own livelihoods.
The challenge for disability organisations as well as health and community development workers in such settings, including occupational therapists, is to work in collaboration with youth with disability in order to facilitate access to resources, skills development and employment opportunities including learnerships, mentorships, volunteer programmes to get work experience. Implementation of policies, including the inclusive education and employment equity policies, need to be positively implemented. On a grassroots level, practical skills development and employment opportunities for all youth needs to be created in these two communities, but especially for youth with disability. These opportunities should be focussed on their abilities rather than their disabilities. By doing this, they would have more assets, resources and livelihood strategies to improve and sustain their livelihoods and realise their productive potential.
ACKNOWLEDGEMENTS
❖ Disabled Youth Enabling Sustainable Livelihood (DYESL) research group lead by the Occupational Therapy Department and Disability Studies Postgraduate Programme at the University of Cape Town.
❖ Occupational Therapy Departments and Community Based Rehabilitation Workers, who participated in this research.
❖ Anneli Hardy for assisting with the statistical analysis.
❖ Funding partners were the National Research Foundation [NRF], South African Netherlands Partnership for Alternative Development [SANPAD] and UCT University Research committee [URC].
REFERENCES
1. Resnik D. Responsibility for Health: Personal, Social and Environmental. Journal of Medical Ethics, 2007; 33 (8): 444-5. [ Links ]
2. World Health Organisation. Definition of Disability 2011 [cited 15 July 2011]. [ Links ] Available from: http://www.who.int/topics/disabilities/en/.
3. United Nations Development Programme. Millennium Development Goals 2010 [cited 5 April 2011]. [ Links ] Available from: http://www.undp.org/mdg/basics.shtml.
4. Stein M, Stein P Weiss D, Lang R. Health Care and the UN Disability Rights Convention. The Lancet, 2009; 374 (9704): 1796-8. [ Links ]
5. United Nations General Assembly. Convention on the Rights of Persons with Disabilities (CRPD) http://www.unhcr.org/refworld/docid/45f973632.html].2007 [cited 5 April 2011]. [ Links ]
6. Mitra S, Posarac A, Vick B. Disability and Poverty in Developing Countries: a Snapshot from the World Health Survey. Social Protection Discussion Papers - 62564. World Bank Social Protection Working Paper, 1109, 2011. [ Links ]
7. Letts L. Health Promotion. Willard and Spackman's Occupational Therapy. Baltimore: Wolters Kluwer/Lippincott Williams and Wilkins; 2009. [ Links ]
8. Keysor J. How does the environment influence disability? Examining the the evidence. Workshop on disability in America: A New look. Washington.DC: The National Academies Press; 2006. [ Links ]
9. Watson R, Fourie M. Occupation and occupational therapy. Transformation through Occupation. London: Whurr Publishers; 2004. p. 19-32. [ Links ]
10. Scaffa M, Brownson C. Occupational Therapy Interventions: Community Health Approaches. Occupational Therapy:Performance, Participation,and Well-being. Thorofare: SLACK Incoporated; 2005. [ Links ]
11. Department of International Development. Sustainable Livelihood Guidance Sheets. 1999 [cited 17 October 2010]. [ Links ] Available from: http://www.livelihoods.org/info/info_guidancesheets.html#1.
12. City of Johannesburg. Diepsloot gets a facelift. 2005 [cited 31 May 2011]. [ Links ] Available from: http://www.joburgnews.co.za/2005/jul/ju128_diepsloot.stm.
13. City of Johannesburg. Making do in Diepsloot. 2011 [cited 24 August 2011]. [ Links ] Available from: http://www.joburg.org.za?index.php?option=com_content&view=article&id=6884&catid=88&Itemid=266.
14. Himlin R, Engel H, Mathoho M. Land use management and democratic goverance in the city of Johannesburg. Case study: Kliptown and Diepsloot. Johannnesburg: Wits Center for Urban and Built Environment Studies and Planacts, 2007. [ Links ]
15. Basil Reed Developments. Cosmo City. 2009 [cited 22 August 2011]. [ Links ] Available from: http://www.brdevelopments.co.za/project28.html.
16. Cowden B. Cosmo City Review. Social Housing Focus Trust. 2006. [ Links ]
17. City of Johannesburg. Cosmo City is a thriving suburb. 2009 [cited 5 August 2011]. [ Links ] Available from: http://www.joburg.org.za/index.php?option=com_content&task=view&id=2089&Itemid=168.
18. City of Johannesburg. Clinic treats Cosmo City. 2010 [cited 23 January 2011]. [ Links ] Available from: http://www.joburg.org.za/index.php?option=com_content&task=view&id=4884&Itemid=202.
19. Dube A. The role and effectiveness of disability legislation in South Africa. Disability Knowledge and Research programme. Executive Summary. 2005. [ Links ]
20. Office of the Deputy President. White Paper on an Integrated National Disability Strategy. 1997 24 August 2011. Available from: www.gov.za/documents/download.php?f=187660. [ Links ]
21. Department of Labour. Employment Equity Act. South Africa: 1998. [ Links ]
22. Department of Education. Special Needs Education. Education White Paper 6 Special Needs Education Building an inclusive education and training system [Internet]. [ Links ] 2006 14 August 2011. Available from: http://www.info.gov.za/whitepapers/200l/educ6.pdf.
23. South African Social Security Agency. You and your grants-2011/2012.2011 12 February 2013. Available from: http://www.sassa.gov.za/Portals/l/Documents/d54e383b-7e3d-4c96-8aa2-4cc7d3bc78f.pdf. [ Links ]
24. Kielhofner G. Research in Occupational Therapy: Methods of Inquiry for Enhancing Practice. Philidelphia: FA. Davis Company; 2006 . [ Links ]
25. Faugier J, Sargeant M. Sampling hard to reach populations. Journal of Advanced Nursing, 1997; 26 (4): 790-7 . [ Links ]
26. Bartlett J, Kotrlik J, Higgins C. Organizational Research: Determining Appropriate Sample Size in Survey Research. Information Technology, Learning, and Performance Journal, 2001;19(1): 43-50. [ Links ]
27. Statistics South Africa. Census 2001: Prevalance of Disability in South Africa. 2005 23 March 2010. Available from: http://www.statssa.gov.za/census0l/html/Disability.pdf. [ Links ]
28. National Youth Commission. National Youth Policy. Pretoria: 1997. [ Links ]
29. UNICEF Education statistics: South Africa: Division of Policy and Practice, Statistics and Monitoring Section; 2008. [ Links ]
30. Council on Higher Education. Higher Education Monitor: The State of Higher Education in South Africa. Advice and Monitoring Directorate, 2009. [ Links ]
31. Statistics South Africa. Quarterly Labour Force Survey Quarter.3 2011 [cited 2 December 2012]. [ Links ] Available from: http://www.statssa.gov.za/publications/P02ll/P02l13rdQuarter2011.pdf.
32. Department of Education. South African Schools Act, 1996. 2011 [cited 2 September 2011]. [ Links ] Available from: http://www.acts.co.za/south_african_schools_act_1996.htm.
33. Greyling A. Reaching for the dream: Quality education for all. Educational Studies, 2009; 35(4): 425-35. [ Links ]
34. Department of Basic Education. Report on Dropout and Learner Retention Strategy. Portfolio Committee on Education. 2011. [ Links ]
35. Ford-Shubrook A. Disability inequity in Orange Farm: Barriers to education for children with disabilities within a township community Johannesburg, South Africa. Thutong South African Education Portal [Internet]. [ Links ] 2008 13 June 2011. Available from: www.thutong.doe.gov.za/ResourceDownload.aspx?id=40097&userid...
36. Grol C, editor The Education of Pupils With Special Educational Needs in Africa, Looked at Within the African Context. International Special Education Congress; 2000; Manchester. [ Links ]
37. Statistics South Africa. Prevalence of Disability in South Africa. 200l 15 March 2011. Available from: http://www.statssa.gov.za/census0l/html/Disability.pdf. [ Links ]
38. Nel E. Rethinking Patterns of South African Urban Growth: 19ll- 200l. Urban Forum, 2011; 22 (4): 33l-42. [ Links ]
39. Soudien C, Baxter J. Disability and schooling in South Africa. Disability and social change: A South African agenda. Cape Town: HSRC Press; 2006. p. 149-63. [ Links ]
40. Coovadia H, Jewkes R, Barron P, Sanders D, McIntyre D. The Health and Health System of South Africa: historical roots of current public health challenge. The Lancet, 2009; 2692 (374): 817 - 34. [ Links ]
41. Obrist B, Iteba N, Lengeler C, Makemba A, Mshana C, Nathan R, et al. Access to Health Care in Contexts of Livelihood Insecurity: A Framework for Analysis and Action. PLoS Medicine, 2007; 4 (10): 1584-8. [ Links ]
42. du Toit R. Unemployed youth in South Africa. The Distressed Generation? 2003 [cited 23 March 2012]. [ Links ] Available from: http://www.hsrc.ac.za/research/output/outputDocuments/2286_duToit_UnemployedYouthSA.pdf.
43. Surender R, Noble M, Wright G, Ntshongwana P. Socail Assistance and Dependency in South Africa: An analysis of attitudes to paid work and social grants. Journal of Social Policy, 2010; 39 (2): 203-2l. [ Links ]
44. Hweshe F. Disability Act being crafted. 2011 [cited 14 February 2012]. [ Links ] Available from: http://www.curamusassociation.co.za/disability-act-.html.
45. Hurst R. Overcoming Obstacles to the Ingetgration of Disabled People. The World Summit on Social Development Copenhagen: 1995 http://www.daa.org.uk/uploads/pdf/Overcoming%20Ob-stacles.pdf. [ Links ]
 Correspondence:
Fasloen Adams
fasloen.adams@wits.ac.za
