


Services on Demand
Journal

Article
 English (pdf)
 Article in xml format
 Article references
 Send this article by e-mail
Indicators
Related links
-
 Cited by Google
 -
 Similars in Google
Share

 Permalink
R&D Journal
On-line version ISSN 2309-8988Print version ISSN 0257-9669
R&D j. (Matieland, Online) vol.31 Stellenbosch, Cape Town 2015
BW SkewsI; RT PatonII; MJ YokoII; SR MorrowII
IFellow SAIMechE. School of Mechanical, Industrial and Aeronautical Engineering, University of the Witwatersrand, beric.skews@wits.ac.za
IISchool of Mechanical, Industrial and Aeronautical Engineering, University of the Witwatersrand
ABSTRACT
A predominantly experimental investigation into the nature of transonic flow within an aerodynamic corner is treated. The work focuses on exploring the shock-induced separation that can occur due to the corner. Effects of dihedral angle, and sharp and filleted 90o corners were studied on a RAE2822 profile wing. Tests were conducted in a shock tube operating as a short-duration transonic tunnel, using oil-film surface flow visualisation techniques. The experimental results are compared to numerical simulation studies. The CFD results correlate well with the experiments. It is shown that a fillet radius disperses the region of separated and reversed flow outwardly from the centre of the corner. Increasing the dihedral angle of the corner significantly delays and weakens the separated region.
Additional keywords: CFD, flow separation, surface flow visualisation
1 Introduction
Transonic flow over a wing in two dimensions is very well documented but details of the flow within the region where two surfaces meet at an angle are limited. The case of supersonic flow in a corner has been well documented, particularly relating to the intersecting wave patterns1 and to some extent to surface effects2,3.
2 Apparatus
2.1 Test equipment
Due to the unavailability of a conventional transonic wind tunnel and limited resources, a standard shock tube was used to generate a short duration transonic facility, which is a rather uncommon approach. Notwithstanding the limitation of a very short test time it does have an advantage over conventional facilities which require expanding a flow, which places restrictions on the achievable Reynolds numbers. A shock accelerated flow increases the sound speed and thus for the same flow Mach number a higher Reynolds number can be reached, so that both Mach number and Reynolds number closer to true flight Mach numbers can be obtained simultaneously. Thus Reynolds numbers of more than 2xl06 can be obtained even for the small chord length associated with shock tube test sections such as in the current case. In much larger facilities Reynolds numbers based on chord length of40x106 have been achieved5. A wave-diagram (x,t plot) is utilised to size the facility within the available space in order to obtain maximum test time4. The shock tube had a cylindrical driver, 9.4 m long and 154 mm internal diameter, pressure tested to l5 bar. The driven section was 36.6 m long including the specially manufactured test section, the balance of the length being made up of commercial rectangular steel tube with outer dimensions of 177 x 127 mm and 10 mm wall thickness. The position of the test section was determined by running a series of wave diagram simulations which track the position of the waves. Theoretically the tube can be considered optimised for maximum flow time when the test section is positioned at the point where the contact surface, reflected incident shock wave and reflected expansion wave all meet. For a given shock wave Mach number, there exists only one driver length to driven length ratio that would allow all three of these features to meet at a single point in space and time. With the constraints of a the tube consisting of a number of fixed lengths and with most tests to be run at Mach 0.83 a test section position of 31.5 meters from the diaphragm station was chosen. It should be noted that theoretically predicted behaviour will differ from actual behaviour of the shock tube since the theory ignores wave attenuation in the tube.
In order to generate the required transonic Mach numbers in the flow, shock Mach numbers between 1.6 and 2.1 are required. For the available driver pressure this necessitated the driven section to be evacuated to about 0.25 bar. Slotted walls with plenum chambers behind them are arranged as the top and bottom walls so as to minimise reflected shock influence. For initial calibration and imaging the sidewalls were of Perspex with visualisation using a standard schlieren system. Details of calibration and comparison with computer simulation for a two-dimensional 12% thick and 42 mm chord RAE 2822 aerofoil have been previously published together with full details of the hardware4. Good results were obtained with test times of up to 40ms, notwithstanding the small scale of the test pieces. The pressure transducers positioned on either side of the test section were used to measure the transit time of the shock between them so as to determine the shock Mach number at the test section from which the flow Mach number is calculated. No transducers were positioned in the test section itself because of the slotted walls and windows. Pressure measurement from the other transducers is influenced by perturbations due to the presence of the test piece and its mount. Other methods such as surface measurements on the test piece itself should be considered.
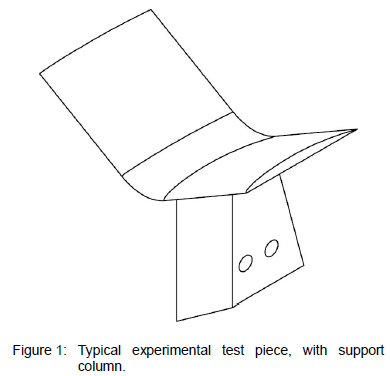
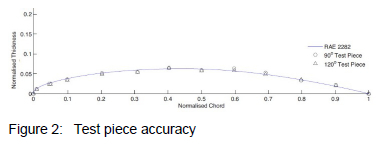
The test pieces for the current tests are similar to that shown in figure 1 with dihedral angles of 90o and 120o either without a fillet or with a circular fillet. They were secured through a base piece to a steel plate which replaced one of the test section windows so that they were viewed perpendicular to the chord line, through the other window. The chord length was 34.28 mm with a fillet radius of 13 mm in some cases. In view of the small size of the model the accuracy of the profile needed to be checked. Measurements were taken with a precision metrology apparatus and are presented in figure 2. There is a slight modulation in the surface with a maximum deviation of 4.2%.
2.2 Visualisation
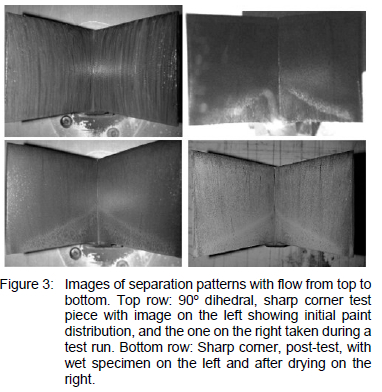
An oil film visualisation technique was used to determine surface flow patterns on the test piece. This involves mixing a fine paint powder in a carrier fluid which is then painted on the surface and becomes distributed across it by the flow. Multiple mixtures were tested to find the best results for this short duration case which first involves the shock wave passing over the model followed by a short duration transonic flow of some 40 ms. Both transformer oil and kerosene were tried as carriers with powders of Titanium dioxide and a coarse and fine powder paint. The best results were for a 4:5 ratio of kerosene to fine red powder paint, together with a little oleic acid to prevent agglomeration. Photographs were taken during the test run, with the camera triggered by the passing shock, and also after a test. After drying the remaining powder layer showed good contrast and results very similar to that taken during the run. This was probably due to most of the kerosene having evaporated during the test. The results are contrasted in figure 3 with the test taken during the run sometimes being negatively affected due to a flare from the light source reflection from the corner. In some tests an additional coloured stripe was painted on the surface to give an indication of transverse flows. Note that the root chord appears to be less than the tip chord, because of the perspective of the imaging, with the corner being further away from the camera.
2.3 Simulation
A computational model mimicked the experimental set up with a domain three chord lengths ahead of and behind it. The flat bottomed aerofoil sections were modelled without the sting in order to reduce the number of complex flow features requiring computation. An inflated version of the aerofoil was created around the test piece so as to allow a locally finer mesh to be created. The results are comparable to the earlier two-dimensional detailed study4 where the numerical simulation was based on a case given by Fluent, and validated through comparison with the large amount of experimental data for the aerofoil used.
3 Results
3.1 Dihedral effects with filleted corners
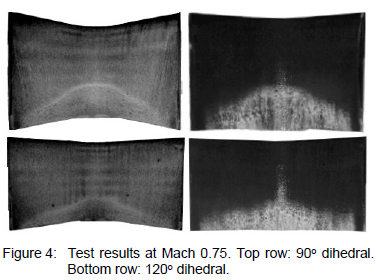
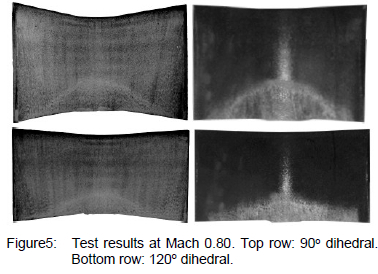
Figure 4 shows the separation patterns at Mach 0.75, with the top row for 90o dihedral and the bottom row for 120o. Those on the left are for the post-test dried version and those on the right those taken during the test, and which have been converted to grayscale. The flare from the light source in the centre is evident. The corresponding tests at Mach 0.80 are given in figure 5.
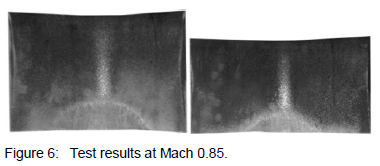
Inconclusive results were obtained for post-test conditions at Mach 0.85, however images taken during the run were successful as shown in figure 6. It was initially thought that the poor post-test results required adjustment to the paint mixture to account for the increase in Reynolds number. Both thicker and thinner mixtures were tried but without success, as well as trying adjustments to the driver pressure, keeping the pressure ratio the same, but results remained poor. No separation was established for tests at Mach 0.90 for both post-test and in-test cases, suggesting that no separation occurred.
3.2 Sharp corner
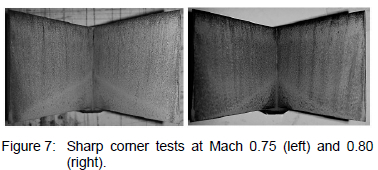
Only three Mach numbers were tested for this case: 0.75, 0.80, and 0.85 with a dihedral of 90o. Two tests were done with the red powder paint and one with two colours: red on the centre half-span and blue outboard. This was done to help identify transverse flows. Results for Mach numbers of 0.75 and 0.80 are given in figure 7 for a single colour case, clearly showing the separation line with a V-shaped pattern starting at the corner. The two-tone results are shown in figure 8. The flow separation line is visible for a Mach number of 0.75, but, as for the filleted corner, not at Mach 0.85.

The interface between the colour bands shows a flow towards the corner, and there is also an indication of inflow at the ends of the span due to the expected tip flows. Care needs to be taken in interpreting flow direction because of the camber of the surface and its inclination due to the dihedral, resulting from the perspective imaging. In these images the paint at the trailing edge in the corner has been washed off the surface. This was noted in a few cases, presumably due to variability in the paint mixture and the complex separated flow field.
3.3 Comparison with simulation
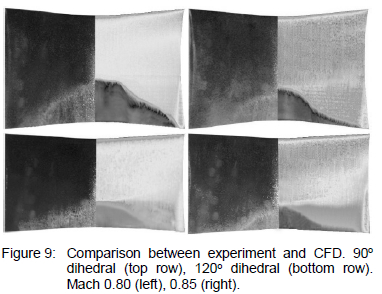
Results from photographs taken during the experiment are compared side-by-side with wall shear plots from the numerical simulation in figure 9, with the experiment on the left and simulation showing surface shear stress on the right. The correspondence is good. It is noted that the transonic shock is evident along the span in the CFD plot, and is slightly ahead of the position in the corner where the separation starts, clearly indicating that it is the transonic shock impingement on the surface that triggers the separation in the corner, as discussed below. The influence of the tip vortex is also evident at the end of the span.
In view of the fair agreement between experiment and CFD the latter can be examined to gain information on the flow in the separated region. The upper image in figure 10 shows the streamlines close to the surface viewed in the same way as for the experiment. There appears to be a small jet on the centreline with two counter rotating vortices, and a kink at half semi-span with a shed vortex. This kink is also noted in some of the experimental results.
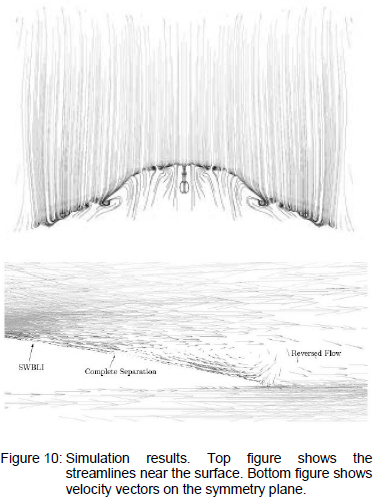
The flow within the separated region is outwards towards the tips. The inward flow at the tip in front of the separation line is also noted. The lower image of velocity vectors on the symmetry plane shows a typical shock wave/boundary layer interaction, SWBLI, with the thickening of the boundary layer as the shock strikes it, followed by flow separation and a vortex within the separation bubble.
4 Conclusion
A small shock tube driven transonic tunnel is shown to be useful for short-duration tests on corner flows. It is shown that the boundary layer separates furthest forward at the corner and the separated region then is swept back along the span. The flow further away from the corner remains attached under the conditions that were tested. Increasing the dihedral angle significantly delays and weakens the separation region. Experimental and numerical analysis are shown to correlate reasonably well. Notwithstanding the small scale of the experiment the facility is shown to be suitable for the demonstration of realistic transonic flow effects.
Acknowledgements
This work was partly supported by funding from the National Research Foundation.
References
1. Gunko YP, Kudryavstev AN and Rakhimov RD, Supersonic inviscid corner flows with regular and irregular shock interaction, Fluid Dynamics, 2004, 39, 304-318. [ Links ]
2. Naidoo P and Skews BW, Supersonic viscous corner flows. Institution of Mechanical Engineers, Part G: Journal of Aerospace Engineering, 2012, 226, 950-965. [ Links ]
3. Settles GS, Perkins JJ and Bogdonoff SM, Investigation of three-dimensional shock/boundary-layer interactions at swept compression corners. AIAA Journal, 1980, 18(7), 779-785. [ Links ]
4. Nash J and Skews BW, A shock tube driven transonic wind tunnel. R&D Journal, 2013, 29, 1-10. [ Links ]
5. Olivier H, Reichel T and Zechner M, Airfoil flow visualization and pressure measurements in high-Reynolds-Number Transonic Flow, AIAA Journal, 2003, 41(8), 1405-1412. [ Links ]
Received 16 September 2015
Revised form 12 November 2015
Accepted 13 November 2015
