


Services on Demand
Journal

Article
 English (pdf)
 Article in xml format
 Article references
 Send this article by e-mail
Indicators
Related links
-
 Cited by Google
 -
 Similars in Google
Share

 Permalink
R&D Journal
On-line version ISSN 2309-8988Print version ISSN 0257-9669
R&D j. (Matieland, Online) vol.26 Stellenbosch, Cape Town 2010
An Evaluation of Simplified Methods to Model the Performance of Axial Flow Fan Arrays
Sybrand J. van der Spuy; Theodor W. von Backström; Detlev G. Kröger
Department of Mechanical and Mechatronic Engineering University of Stellenbosch, Private Bag X1, Matieland, 7602, South Africa. E-mail: sjvdspuy@sun.ac.za
ABSTRACT
This paper investigates two simplified methods to model axial flow fans in a multiple fan operating environment using computational fluid dynamics (CFD). The application of the two methods are explained and illustrated, after which they are applied to a multiple fan CFD model. The CFD results are compared to experimental results to illustrate the applicability of the methods. It is concluded that the simplified presentation of an axial flow fan is particularly helpful in predicting the system volumetric effectiveness of multiple fan installations subjected to adverse inlet flow conditions, particularly during windy periods.
Additional Keywords: Air-cooled, array, pressure jump, steam condenser
Nomenclature
c chord length [m]
C dimensionless force coefficient
D diameter [m]
ƒ volumetric force term [N/m3]
H fan unit platform height [m]
K dimensionless coefficient
n number of fans per row
n number of fan blades
p pressure [N/m2]
r radius [m]
t time [s]
u absolute velocity term in momentum equation [m/s]
V volume flow rate [m3/s]
v absolute velocity [m/s]
w relative velocity [m/s]
x distance in Cartesian coordinates [m]
Greek Symbols
α angle of attack [°]
β flow angle, relative to plane of rotation [°]
δ force [N/m]
Δ delta
θ circumferential angle [°]
ρ density [kg/m3]
τ shear stress tensor [N/m2]
Subscripts
ave average over fan plane of rotation
D drag
F fan
fan ss fan static-to-static
fan ss ' fan static-to-static with inlet loss
HE heat exchanger
inlet inlet plane just in front of fan
loss loss coefficient
L lift
ref reference
∞ infinity
i,j tensor subscripts
x,y,z Cartesian coordinates
1. Introduction
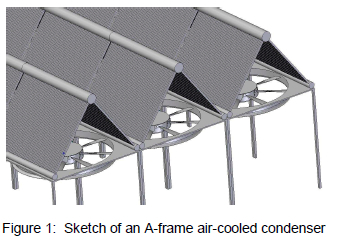
In power plant steam condensers, the cooling medium, air, is blown across finned tube bundles using a large diameter axial flow fan (see figure 1).
Direct dry-cooled power stations, favoured in arid regions because of their relatively low level of water consumption, are equipped with large horizontal arrays of steam condensers and axial flow fans. The world's largest direct air-cooled power plant currently in operation has an array of 288 axial flow fans, 9.1 m in diameter, located 45 m above ground level1. Operating axial flow fans in an array format causes additional, and often unaccounted, flow losses, due to non-ideal flow patterns2. Poor performance of the fans located near the edges of the array has been observed in large power plants, particularly during windy periods3,4.
The horizontal orientation of the fan array means that flow enters the volume underneath the array from a direction that is perpendicular to the "designed" flow direction of the fans. Inlet flow separation occurs at fans that are located near the edge or periphery of the array, while off-axis inflow occurs widespread through all fans installed in the array5,6.
Various methods have been used to model axial flow fan arrays in computational fluid dynamics (CFD)3-9. The most accurate would be an explicit method which models the fan blade geometry in full detail. Since the distorted inlet conditions as described above are asymmetrical, a full 360° CFD simulation of the fan would be required. Assuming that a minimum mesh spacing of 200 units around the perimeter of the blade profile, a mesh spacing of 100 units along the blade length and twenty units perpendicular to the blade surface are required to resolve the flow around a single fan blade, a fan with eight blades would require about 3.5 × 10 cell volumes just to resolve the flow around the individual fan blades. The use of simplified, implicit models of axial flow fans that simulate the effect that the fan would have on the flow field should therefore be considered when modelling multiple axial flow fans as part of a larger plant installation. The actuator disk and pressure jump methods described in this document are two such simplifications9.
This document investigates and compares the actuator disk and pressure jump methods. Both methods were validated by comparing single fan performance predictions with actual test data. After validating single fan performance, the methods were implemented in CFD simulations of multiple fan installations. These simulations were compared with the empirical prediction model derived by Salta and Kröger10.
Two fan designs are considered in this document. The first is an 8-bladed industry-standard cooling fan, referred to as the "A fan", and has a hub-to-tip ratio of 0.15. The second fan is also 8-bladed, but with a hub-to-tip ratio of 0.4 and is referred to as the "B-fan". Fan diameters referred to in this document would be either test size (1.542 m) or installed size (9.145 m).
2. The Actuator Disk Model (ADM)
2.1 Description
The actuator disk axial flow fan model, as used for these simulations, is based on the model described by Meyer and Kröger11. This particular actuator disk model simulates the effect of the individual fan blade elements on the flow field by using the lift and drag characteristics of the blade profile (see figure 2).
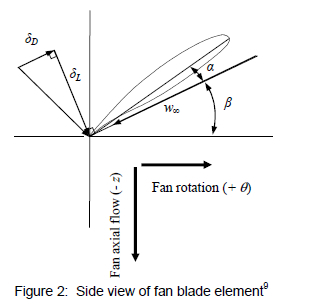
Each fan blade is subdivided into radial elements (corresponding to the mesh spacing of the CFD model). The lift and drag forces per radial element length of blade acting on the flow are calculated using the following equations:
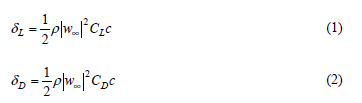
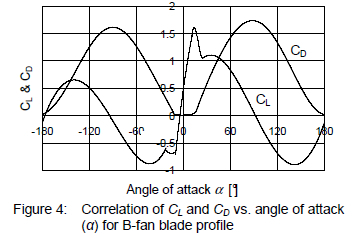
The lift and drag coefficients are the same as those often given in literature for standard two-dimensional airfoil data based on an angle of attack α. Using the methods detailed by Bredell12 the coefficients were determined from two-dimensional CFD simulations of the specific blade section, with the results shown in figures 3 and 4. It should be noted that w∞ is the average relative velocity, composed of components in the axial and circumferential directions over the blade element only (the actuator disk model in its current form ignores radial flow).
Once the forces acting on the air stream are known, these are transformed into volumetric source terms that are inserted into the equation for linear momentum:
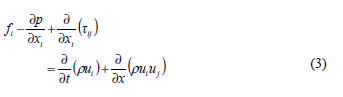
The actuator disk model is incorporated into the CFD model using a user-defined subroutine where the source terms are calculated using equations 1 to 6, based on velocities extracted from the CFD-simulation (note that the angle θ is defined in the xy-plane according to the right-hand rule). The forces exerted on the flow field are calculated for each cell located in the actuator disk, based on the flow conditions at corresponding cells upstream and downstream of the disk.
2.2 Validation of the actuator disk model
The CFD-results obtained using the actuator disk model were compared with fan test results compiled by Stinnes and Von Backström13 using a type-A fan test installation, as defined by the British Standards 84814 (see figure 5).

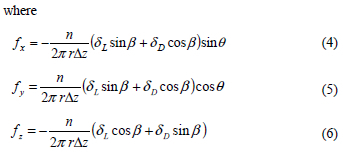
To investigate and validate the actuator disk model, a three-dimensional CFD analysis of the fan, inside the test facility, was conducted for its full first quadrant operating range (zero flow point to zero pressure point). The geometry for the simulation was compiled in Gambit version 2.2.30. A typical lay-out of the geometry and the mesh detail surrounding the actuator disk is shown in figure 6.
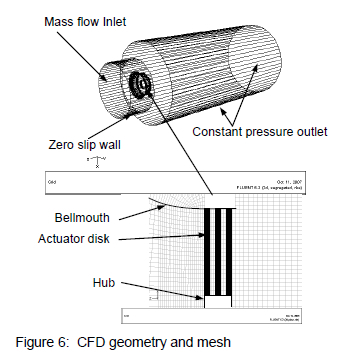
The total number of cell volumes in this mesh shown in figure 6 was 650 000. The mesh was generated using only hexahedral elements to facilitate the structured approach required by the actuator disk method. The actuator disk method requires the cell volumes in the centre disk to match the radial and circumferential location of the reference cell volumes in the up and downstream disks. The mesh density upstream of the rotor was higher than downstream of the rotor to account for flow variation due to the presence of the solid rotor hub.
An investigation was conducted to evaluate the effect of the refinement of wall cell volume height on the inside surface of the bell mouth from a y+ value of 300 to 30 and it was found that this had a negligible effect on the results (at the design point it had an effect of less than 0.25 % on the value of fan static pressure). To evaluate the effect of the overall mesh size on the CFD results, adaptive mesh refinement performed on each of the discussed fan models, showed that when increasing the number of cell volumes from 650 000 to 1 000 000 the fan static pressure value at the design point changed by less than 0.5 %
The simulations modelled the BS 848 fan test facility, using FLUENT™ version 6.2.16. Although Meyer and Kröger11 used the standard k-ε turbulence model in their actuator disk model (ADM), it was decided to use the realizable k-ε turbulence model because of its ability to solve axisymmetric jet flows more accurately, as reported by Shih et al.15. The realizable k-ε turbulence model and QUICK interpolation scheme were subsequently used for all CFD-simulations.
The results from the analyses, compared with the measured test data for the B-fan, are shown in figure 7 (bear in mind that the realizable k-ε turbulence model was used in all simulations). The graph also includes the results for the pressure jump method (PJM) which are discussed in subsequent sections of this document.
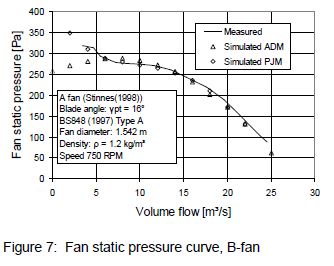
This analysis shows that the actuator disk does not represent the operation of the fan correctly at flow rates below 8 m3/s (possible reasons for this are discussed at the end of this paper). The validation was repeated for the test-size A-fan. The test results were once again compiled by Stinnes and Von Backström13. The results from the analysis are shown in figure 8.
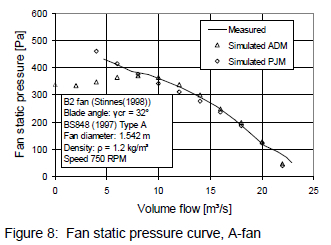
Similar to the B-fan, the results obtained for the A-fan correlate well within the normal operating range of the fan. A larger number of cell volumes were required to model the A-fan to accommodate the effect of flow recirculation close to the hub due to its much smaller hub-to-tip ratio16.
3. The Pressure Jump Method (PJM)
3.1 Description
The pressure jump method utilises a static-to-static pressure increase that occurs at the location of the fan rotation plane. The static-to-static pressure jump is derived from the standard "fan static pressure" curve, as obtained from the fan supplier or standard fan performance test data9. It is important to note that the "fan static pressure" values specified by the supplier are actually fan total-to-static pressure values and therefore require conversion to fan static-to-static pressure values.
Although implemented on a per-cell basis, the value of the pressure jump is based on the average velocity through the fan annular area and neglects the local condition of the flow fan as well as the local properties of the fan (compared to the actuator disk model where the value of the source terms vary according to the flow field and fan blade properties). The validity of using the pressure jump method is discussed in further detail in section 4.
3.2 Calculation
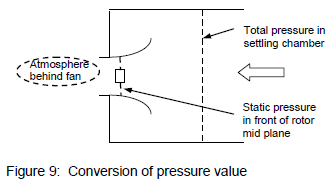
As mentioned in section 2, fan supplier data, as used for air-cooled power plant steam condensers, are often compiled using a BS 848 type-A fan test installation. The fan pressure data is calculated from an average static pressure value that is measured in a plane, relative to atmosphere, in a settling chamber, 1.25 fan diameters upstream from the fan. The test standards specify that the static pressure measured at this location may be assumed to equal the total pressure in this location, because of the relatively small axial velocity value14.
To translate from the total-to-static to the static-to-static curve, the total pressure measured in the settling chamber needs to be converted into a static pressure value directly upstream of the fan rotor mid plane (fan rotation plane) (see figure 9)9.
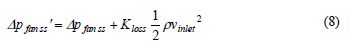
A 4th order polynomial equation for the "fan static pressure" curve was obtained by fitting a curve to the test data of the 1.542 m test fans shown in figures 7 and 8. To convert this curve to a static-to-static pressure curve, the dynamic pressure, based on the average annular air speed in the axial direction, in the fan rotation plane, is added as follows9:

To provide for bell mouth inlet losses in front of the fan, a loss factor, as defined by Idelchik17, was added to the equation as follows:
Idelchik17 specifies a value of 0.07 for the loss factor. It should be noted that the velocity related to the loss factor in equation 8 is the axial velocity based on the area of the fan duct only and does not consider the area of the hub.
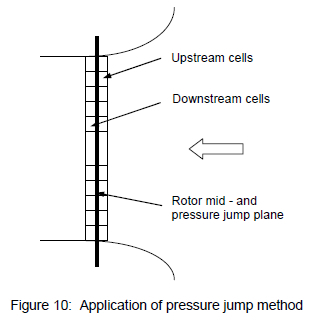
3.3 Validation
The same geometric CFD model, boundary conditions, turbulence model and differencing scheme that was used to simulate the actuator disk model was used to validate the pressure jump method. The cell face region where the pressure jump would occur represents the rotor mid plane (see figure 10). The effect of the fan is implemented as a pressure gradient in the momentum equation (equation 3), applied to the upstream and downstream cells shown in figure 10. The pressure jump is added to the simulation model by programming a static pressure versus axial velocity curve into FLUENT™'s standard "fan" internal boundary condition.
A typical CFD simulation using the pressure jump method ran about 10% faster than the same simulation with an actuator disk model.
The correlation achieved between the measured and modelled data within the normal fan operating range was excellent for both fans (see figures 7 and 8).
4. Application of the ADM and PJM
To investigate the performance of axial flow fan arrays with varying degrees of distorted inlet flow, the effective platform height of the installation, as modelled in the CFD simulations, was varied. By doing this, the cross flow velocity and consequent inlet flow distortion in front of the fan could be adjusted.
Hotchkiss et al.5 and Stinnes and Von Backström13 found that under off-axis inflow conditions (note that for off-axis inflow the cross flow velocity is the same everywhere) the "fan static pressure" is reduced in magnitude by the dynamic pressure associated with the cross-flow velocity component immediately upstream of the fan. The cross flow velocity component affects only the static pressure in front of the fan and not the actual value of static-to-static pressure increase. This is attributed to the fact that the effect of the cross flow velocity on the relative flow angles and velocities over the fan blades effectively cancels out when considering fan blades running 180 ° apart, with and against the direction of cross flow5.
Since the static-to-static pressure increase is independent of inflow angle, the pressure jump method should yield accurate results when analysing fans subjected to off-axis inflow. When considering flow separation that occurs in front of the fan rotation plane, the fan would follow its static-to-static operating curve as long as the area of separation is such that similar inlet flow conditions prevail over an angular section of the fan annular space. The fact that the pressure jump method is based on average values does however mean that the flow conditions downstream of the fan would not be correct.
In principle it can be expected that, if any deviation or distortion of inlet flow occurs uniformly over an angular annular section of the fan rotation plane, the fan will follow its static-static operating curve obtained under standard test conditions.
4.1 Single fan computational model
To simulate the performance of an axial flow fan under installed conditions, a single fan row section of an air-cooled condenser was modelled in CFD (see figure 11).
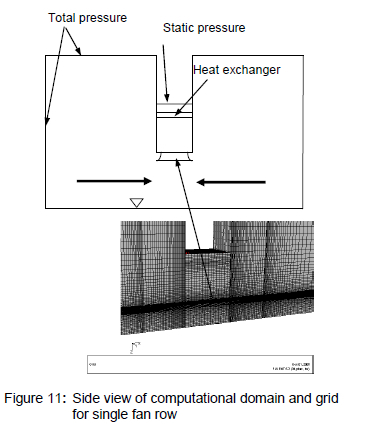
The fan unit was modelled to consist of a bell mouth inlet, axial flow fan, plenum chamber and heat exchanger. The model had a total pressure inlet boundary 200 m upstream, on either side of the fan row and a static pressure outlet boundary 2 m downstream of the heat exchanger (see figure 11). The analysis focussed on the inlet effects only.
No provision was made in the model for possible recirculation of the exhaust flow. The model with the smallest platform height made use of 450 000 cell volumes. To investigate the effect of mesh size, this value was extended to 700 000 volumes using adaptive mesh refinement. This had an effect of less than 0.1 % on the simulated value for air mass flow rate through the fan.
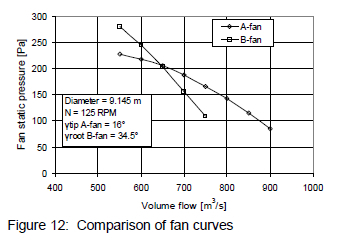
The single fan simulations were based on an installed fan diameter of 9.145 m. Both the A-fan and B-fan mentioned in section 1 were considered in these simulations. The installed-size operating curves for these two fans were obtained by scaling test data obtained for 1.542 m diameter fans. A comparison between the above two fan curves shows the B-fan having a much steeper "fan static pressure" curve than the A-fan (see figure 12).
The heat exchanger shown in figure 11 was modelled as a porous region with resistance properties given by the equations from Bredell12:

The above equation for system resistance, coupled to the fan characteristics of both the A-fan and B-fan, using either the actuator disk or pressure jump methods, corres3ponds to within 2 % of a reference flow condition of 650 m3/s. The CFD model made use of the realizable k-ε model and the QUICK interpolation scheme.
4.2 Multi-fan computational model
To simulate the performance of multiple axial flow fans, a 2-fan section of an array of air-cooled condensers was modelled to represent a 4-fan row of fans inside a large array of air-cooled condensers (see figures 13 and 14). The model with the lowest platform height consisted of 500 000 cell volumes. Increasing the number of cell volumes to 900 000 using adaptive mesh refinement had a 2.5 % and 0.5 % effect on the simulated value for air mass flow rate through the outer and inner fan respectively.


4.3 Installed fan experiments
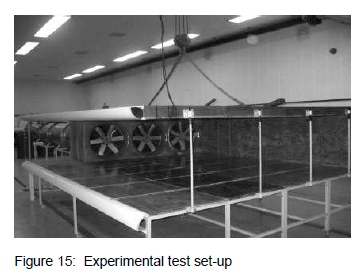
Salta and Kröger10 describe a set of experiments where the effect of platform height on the performance of both a single row and a multiple axial flow fan installation were investigated. These experiments were based on similar, earlier work done by Russel and Peachey18. Figure 15 shows a picture of the experimental set-up for three fans (the number of fans in the system could be adjusted).
The CFD results were compared with an empirical correlation derived by Salta and Kröger10, to express the volumetric effectiveness of the installation as a function of dimensionless platform height as follows (Salta and Kröger10):
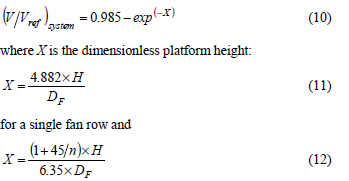
for a multiple fan row. In the above equations n is the total number of fans per row, H is the platform height and DF is the fan diameter.
5. Results
5.1 Single fan row correlation
The numerical results obtained for volumetric effectiveness vs. platform height for both the A and B-fan single fan row unit were compared with the experimental correlation of Salta and Kröger10. The results of the comparison are shown in figure 16.
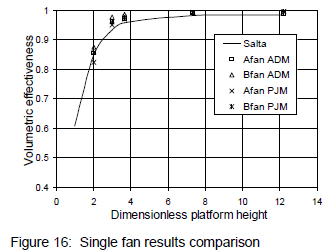
Figure 16 shows that the numerical results for both methods correlate well with the experimental values of Salta and Kröger at all the platform heights that were simulated (within 5 %). The biggest difference in results exist at moderate platform heights where the actuator disk method applied to the B-fan calculates a volumetric effectiveness that is 4.4 % higher than the value predicted by Salta and Kröger.10
5.2 Multiple fan correlation
The numerical results for both the A and B-fan, 2-fan unit were again compared with the experimental correlation of Salta and Kröger10. The results of the comparison are shown in figure 17.
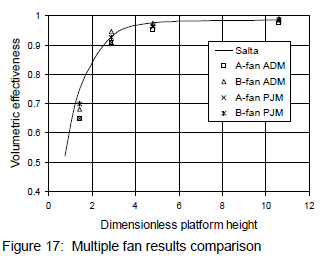
The numerical results for both methods again correlate well with the experimental values of Salta and Kröger10 at moderate to high platform heights (within 2 %). At very low platform heights however, the numerical results under predict the experimental values by a maximum of 10 % (A-fan, actuator disk model) and a minimum of 5 % (B-fan, pressure jump method). This can be attributed to the limited range of application of the simplified fan models (as discussed in section 6).
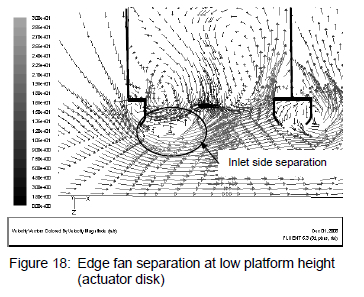
5.3 Edge fan separation
Viewing CFD-results of the multiple fan simulation on a plane through the centre of the modelled geometry, the occurrence of separation on the inlet side of the edge fan is clear. A vector plot of the predicted separation in front of the edge fan (simulating the A-fan), predicted using the actuator disk model, is shown in figure 18.
Another vector plot of the predicted edge fan separation using the pressure jump method is shown in figure 19.

When comparing the extent of separation occurring at the inlet of the edge fan for figures 18 and 19, it is shown that the pressure jump method predicts a larger volume of separation in front of the fan. Secondly, the nature of the flow patterns downstream of the fan displayed by the results using the actuator disk model is more intricate with distinctive recirculation zones visible after the fan. The results for the pressure jump method do not display the same recirculation zones downstream of the fan.
6. Conclusion
6.1 Test fan simulation
Two simplified methods to simulate the performance of axial flow fans were investigated. It is shown that both these methods can simulate fan operation accurately when replicating the fan performance curve within its normal operating range. The number of cell volumes required to represent the operation of the axial flow fan is considerably less than when modelling the fan in full detail.
Due to fact that the actuator disk model considers the local blade and flow field properties when calculating the momentum source terms, it gives a more accurate representation of the flow field. However, the actuator disk model does not represent the fan performance curve correctly at low flow rates due to it assuming axial flow over the fan blade at all times and therefore ignoring the presence of radial flow over the blades at low flow rates. The pressure jump method is purely a reflection of the fan performance curve and therefore represents the operation of the test fan (based on the extent to which the simulation predicts the performance curve) correctly at all flow rates.
The above conclusions are applicable to both the actuator disk model and pressure jump method for both fan configurations that were simulated.
6.2 Installed fan simulations
The results from the simulations of the installed fans (both single fan row and multiple fans) correlate within 5 % with the empirical curve of Salta and Kröger10 at medium to high platform heights and show the detrimental effect of inlet flow distortion on fan volumetric effectiveness. At low platform heights there is however a bigger difference in values (as high as 10 %) between the simulated results and the results of Salta and Kröger10 as well as between the simulated results for the different fan geometries.
6.2.1 Simplified fan model
Both the simplified methods display the occurrence of flow separation in front of the edge fans and both these methods could be applied to evaluate the effectiveness of fan inlets under distorted inlet conditions.
The pressure jump method displays an improvement over the actuator disk model in its ability to represent the fan performance curve at low flow rates. As mentioned in section 4, if the flow condition is uniform over an angular annular section (as found in a fan test facility), the pressure jump method would work well, since, by nature of its relationship to the fan performance curve, the pressure jump method assumes inlet properties to correspond to the uniform inlet properties found in a fan test facility.
The pressure jump method neglects any form of fan exit swirl velocity distribution. As shown in figure 5, a BS 848 type A test set-up allows the fan exit swirl energy to be dissipated into the free atmosphere behind the fan. This corresponds to the forced draught condition, detailed in section 1 and modelled in section 4, where the downstream heat exchangers remove the swirl generated by the fan. If the detail of the flow patterns downstream of the fan would form part of the investigation, the use of a swirl distribution with the pressure jump method or the use of the actuator disk model should be considered.
6.2.2 Fan geometry
A comparison of volumetric effectiveness for the A-fan and B-fan (both using the pressure jump method) is included in figures 16 and 17. At very low platform heights the volumetric effectiveness of the B-fan is 2.5 % to 5 % higher than that of the A-fan and 5 % lower than the empirical curve of Salta and Kröger. As shown in figure 12, the A-fan and B-fan have distinctly different fan static pressure curves, which in turn can be attributed to the difference in design described in Section 1. Stinnes and Von Backström concluded that the slope of the fan static pressure curve at the operating point determines a fan's ability to handle cross flow13.
This indicates that the volumetric effectiveness of a fan under distorted inlet conditions is dependant on fan geometr1y0 and that the empirical correlation of Salta and Kröger10 should be extended to make provision for the characteristics of the fan itself, something not mentioned by previous investigators16.
Finally the simulations confirm previous results by Bredell12 and van der Spuy et al.9 that suggest that axial flow fans with larger hub-to-tip ratio's (and consequently steeper pressure curves) would be less susceptible to distorted inlet conditions, regardless of whether cross flow or separation occurs in front of the fan.
7. Recommendation for Further Work
Based on the results of this investigation, the authors recommend that a full explicit CFD simulation of an axial flow fan be performed and the results compared with results obtained using the pressure jump method and actuator disk model. It is also recommended that a more detailed study be conducted to determine the range of application of the pressure jump method and actuator disk method.
References
1. Kröger DG, Air-cooled Heat Exchangers and Cooling Towers, PennWell Corporation, Tulsa, 2004.
2. Monroe RC, Improving cooling tower fan system efficiencies, Combustion Magazine, 1979, 50 (11), 20-26. [ Links ]
3. Goldschagg HB, Vogt F, du Toit CG, Thiart GD and Kröger DG, Air-cooled steam condenser performance in the presence of crosswinds, EPRI TR-1084832113, Proceedings: Cooling Tower Technology Conference, St. Petersburg, Florida, 1997, 1.61 - 1.77.
4 Van Staden MP, An Integrated Approach to Transient Simulation of Large Air-cooled Condensers using Computation Fluid Dynamics, PhD Thesis, Department of Mechanical Engineering, Rand Afrikaans University, South Africa, 2000. [ Links ]
5. Hotchkiss PJ, Meyer CJ and Von Backström TW, Numerical investigation into the effect of cross-flow on the performance of axial flow fans in forced draught air-cooled heat exchangers, Applied Thermal Engineering, 2006, 26, 200-208. [ Links ]
6. Meyer CJ, Numerical Investigation of the effect of inlet flow distortions on forced draught air-cooled heat exchanger performance, Applied Thermal Engineering, 2005, 25, 1634-1649. [ Links ]
7. Thiart GD, and Von Backström TW, Numerical simulation of the flow field near an axial fan operating under distorted inflow conditions, Journal of Wind Engineering and Industrial Aerodynamics, 1993, 45, 189-214. [ Links ]
8. Coetzee RV, Numerical Simulation of an Air-cooled Heat Exchanger, MEng thesis, School of Mechanical and Materials Engineering, Potchefstroom University for Christian Higher Education, South Africa, 2000. [ Links ]
9 Van der Spuy SJ, Von Backström TW and Kröger DG, Performance of low noise fans in power plant air cooled steam condensers, Noise Control Engineering Journal, 2009, 57 (4), 1-7. [ Links ]
10. Salta CA and Kröger DG, Effect of inlet flow distortions on fan performance in forced draft air-cooled heat exchangers, Heat Recovery Systems and CHP, 1995, 15, 555-561. [ Links ]
11. Meyer CJ and Kröger DG, Numerical simulation of the flow field in the vicinity of an axial flow fan, International Journal for Numerical Methods in Fluids, 2001, 36, 947-969. [ Links ]
12. Bredell JR, Numerical investigation of fan performance in a forced draft air-cooled steam condenser, MScEng thesis, Department of Mechanical and Mechatronic Engineering, University of Stellenbosch, South Africa, 2005. [ Links ]
13. Stinnes WH and Von Backström TW, Effect of cross-flow on the performance of air-cooled heat exchanger fans, Applied Thermal Engineering, 2002, 22, 1403-1415. [ Links ]
14. British Standards Institution, Part 1: Methods for Testing Performance, Fans for General Purposes, BS 848. 1980.
15. Shih TH, William WL, Shabbir A, Yang Z and Shu J, A new k-ε eddy viscosity model for high Reynolds number turbulent Flows, Computers Fluids, 1995, 24 (3), 227-238. [ Links ]
16. Bredell JR, Kröger DG and Thiart GD, Numerical investigation of fan performance in a forced draft air-cooled steam condenser, Applied Thermal Engineering, 2006, 26, 846-852. [ Links ]
17. Idelchik IE, Handbook of Hydraulic Resistance, 3rd Edition, Begell House, 1994.
18. Russell CMB and Peachey J, Air inflow effects on fan performance in air-cooled heat exchangers, International Conference on Fan Design and Applications, Guilford, England, September, 1982.
Received 15 October 2009
Revised form 7 June 2010
Accepted 7 June 2010
