


Services on Demand
Journal

Article
 Article in xml format
 Article references
 Send this article by e-mail
Indicators
Related links
-
 Cited by Google
 -
 Similars in Google
Share

 Permalink
R&D Journal
On-line version ISSN 2309-8988Print version ISSN 0257-9669
R&D j. (Matieland, Online) vol.23 Stellenbosch, Cape Town 2007
Aerodynamic Coefficients of Stationary and Spinning Cricket Balls
A.T. SayersI; N.J. LelimoII
IMSAIMechE Professor, Department of Mechanical Engineering, University of Cape Town, Rondebosch, 7700, South Africa. E-mail: Anthony.Sayers@uct.ac.za
IIPost-graduate Student, Department of Mechanical Engineering, University of Cape Town
ABSTRACT
The flight of a cricket ball after leaving the hand of a bowler is, for given atmospheric conditions, principally governed by the speed of the ball, the angle of the seam to the direction of flight, any rotational spin applied to the ball, and the state of its outer surface with regard to the degree of wear and roughness. This paper describes the design of a wind tunnel test rig to accurately measure the net lift, drag and side (swing) forces on stationary and spinning cricket balls. The measurements were performed on new unused balls and artificially roughened balls at wind tunnel air velocities between 6 and 40 m/s (2.7 x 10⁴< Re < 1.8 x 10s), and seam angles between 0 and 90°. The spin speed range was between 2 and 8 revolutions per second (rps). From the basic data, aerodynamic lift, drag and side force coefficients are presented and display anomalies to account for the behaviour of the ball during play. Numerous critical Reynolds numbers are shown to exist where discontinuities in lift and side force occur.
Additional Keywords: Seam, lift, drag, side forces
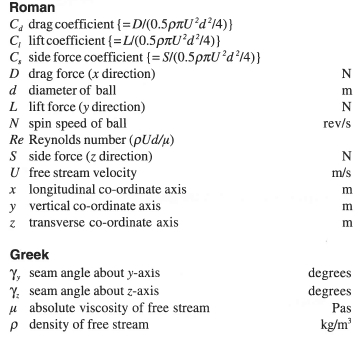
Nomenclature
1. Introduction
The game of cricket is a multi-million dollar sport attracting thousands of live spectators in stadiums, while millions watch on television throughout the world. The fascination of the game is of course the duel between the batsman and the bowler. And while bowlers are often elevated by their supporters to a god-like status due to their exploits in controlling the flight or movement of the ball after bouncing on the pitch, it is doubtful that either they or the bowlers themselves understand the physical principles behind such feats. Two important phases exist in the delivery of a cricket ball. The first is a free flight phase lasting from the time the ball leaves the bowler's hand to when it bounces on the pitch. During this time, the movement of the ball it totally under the control of aerodynamic forces. The second phase is the flight of the ball after bouncing off the pitch, and moving on towards the batsman. This second phase is in the main governed by the orientation of the ball when it hits the pitch, and is outside the control of the bowler. This paper is concerned with the aerodynamics of the first free flight phase.
The data of Achenbach1,2 for flow past smooth spheres hardly assists in explaining the reasons for the flight trajectories of a cricket ball. This is because the outer leather covering of the ball is to some extent rough, even when new, while during the course of a game, it becomes pitted and roughened from contact with the pitch.
There is also a primary 'seam', which is raised about 2 mm above the spherical surface of the ball. On either side of this primary seam and parallel to it around the surface are two rows of 80 to 90 stitches that stand about 1 mm above the spherical surface. Some designs of ball, known as four-piece balls, may also have a secondary seam with internal stitching at right angles to the primary seam. Finally, the bowler can impart spin up to about 15 revolutions per second (rps) about an axis through the centre of the ball, giving rise to a Magnus effect force. Hence the orientation of the seam to the direction of flight, the speed of the ball (i.e. the Reynolds number), and whether the ball is spinning about some axis will all to some extent influence the motion of the ball through the air. The speed at which the bowler delivers the ball can be categorized as fast bowling, where the speed is in the range 36 < U < 41+ m/s (130 to 150+ km/h); medium pace bowling, in the range 26 <U< 36m/s (95 to 130 km/h); and slow bowling, in the speed range 20 < U < 26 m/s (70 to 95 km/h). In fast bowling the batsman is deceived into playing a poor shot by the sheer speed of the ball. The ball is generally held with the seam plane vertical, aligned down the pitch and delivered so that the seam plane remains upright as it travels through the air with very little lateral swing. In medium pace seam bowling, the seam plane is angled to the flight direction to give the ball 'swing' in the air, while in slow bowling, the bowler imparts significant spin to the ball, which influences its flight path through the air and the direction of movement of the ball, off the pitch, after it bounces. However, all types of bowlers are able to spin the ball to give added 'movement' to it as it flies through the air. Shining of the ball surface to keep it smooth on one side of the seam whilst allowing the other side to become rough and worn through play can affect the boundary layer flow, and therefore the pressure distribution around the surface of the ball, thus further influencing the net force on the ball.
Lighthill3, in a discussion of the pressure distribution around a sphere, mentions in passing the swing of a cricket ball. Mehta and Wood4 and Metha5 quantified important parameters in the bowling of a cricket ball stating that the critical Reynolds number for transition from a laminar to a turbulent boundary layer was approximately 1.5 × 10⁵, which is slightly lower than for a smooth sphere, and which corresponds to a speed of about 32 m/s (115km/h).
Although there is much experimental data describing the aerodynamic characteristics of smooth and rough spheres and baseballs,1,2,6-10 the special surface characteristics of a cricket ball renders the use of that data unsuitable for the prediction of the aerodynamic forces on a cricket ball. Of cricket ball data, Barton11 suspended a cricket ball, pendulum like, in an air stream and measured the transverse angular deflection, from which he calculated the side force on the ball. This was done for seam angles of 15° and 30° to the air stream. When used (10 over) balls were similarly tested, he found that at 0° seam angle, a relatively large side force also unexpectedly developed. He regretted that tests were not carried out at 0° on a new ball. Barton11 also experimented with spinning balls, the spin being imparted by rolling the balls down a ramp and projecting them into the air stream. The side forces were calculated from measured deflections upon landing, and known datum conditions. Barton also stated that his experiments contained weaknesses pertaining to the means of suspension of the ball and the simplified mathematical analysis used, indicating that further detailed experiments in the same vein should be conducted. Sherwin and Sproston12 placed a trip wire around a smooth sphere to simulate the seam on a cricket ball and compared the sideways force and drag force with that on a cricket ball at seam and corresponding trip wire angles of 30° and 45°. The force measurements were made using a strain gauge attached to the cricket ball support sting. In a review of the aerodynamics of sports balls, Mehta5 presented further unpublished data for stationary and spinning cricket balls and Sayers and Hill13 presented stationary and spinning ball data for slow and medium pace bowling speeds up to 30 m/s. The phenomenon of reverse swing was investigated by Sayers14 using an enlarged model cricket ball and reducing the results to forces on an actual ball using similarity considerations.
The current paper describes experiments carried out to determine, by direct measurement, a comprehensive set of data of the aerodynamic forces of both stationary and spinning cricket balls. This was done for different orientations of the seam to the free stream, for a wide range of seam angles at bowling speeds up to 40 m/s, and for spin speeds up to 15 rps. Experiments were also performed on an artificially roughened ball.
1.1 Orientation of the ball
The important physical parameters, which affect the flight of the ball, are shown in figures 1 and 2. The ball has three mutually perpendicular axes x,y,z in the horizontal, vertical and sideways directions respectively. It is assumed to move through still air. and this is reproduced in a wind tunnel by holding the ball stationary in an air stream of density ρ and dynamic viscosity μ, flowing in the x-direction and perpendicular to the y-z plane with velocity U. In general the resultant force acting on the ball can be resolved into three mutually perpendicular components, namely the drag force D, the lift force L and the side force S acting in the x-, y-, and z-directions respectively. Whether or not all three component forces are present will depend upon the seam angle of the ball and any spin that may be applied to it. The five parallel lines angled across the surface depict the primary seam and its associated lines of stitching.
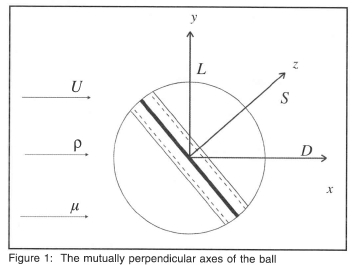
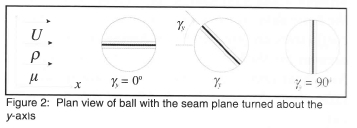
Figure 2 shows a plan view of the ball with the seam turned through angle γy about the vertical y-axis. In this configuration, a drag force D and side force S will exist in the x- and z-directions respectively, but there should in theory be no lift force in the y-direction since the flow field and therefore the pressure distribution on either side of the horizontal x-z plane is symmetrical. The above considerations are for a new stationary ball, and any spin imposed on the ball about any axis through its centre, or any asymmetrical wear on the surface of the ball will change those considerations. For example, spin about the z-axis in figure 2 with γy = 0° will make the ball rise or dip due to a Magnus effect force being set up in the vertical x-y plane, while spin applied about the vertical y-axis will generate a Magnus effect side force in the z-direction parallel to the horizontal x-z plane.
2. Experimental Apparatus
2.1 Wind tunnel
The experiments were carried out in an open-jet return circuit wind tunnel, which was driven by a 12-bladed variable-pitch axial flow fan. The open jet test section was 610 mm wide × 430 mm high, with corner fillets at the throat exit, and a working test section length of 1 m, the area reduction ratio from the settling chamber to the throat being 19:1. The velocity variation across the test section jet was better than 1 per cent while the turbulence intensity was better than 0.4%. Reliable wind tunnel testing requires the turbulence intensity to be better than 0.6 %15. In this wind tunnel, low turbulence intensity is achieved by the provision of a long flow path between the fan and the settling chamber, the location of damping screens between the last set of corner turning vanes and the settling chamber, and a large contraction ratio between the settling chamber and the test section.
The maximum velocity attainable in the test section was 41 m/s. With the cricket ball in the test section, its area projected upstream in y-z plane resulted in a solid blockage ratio of 1.5 per cent, which is considered negligible for this open-jet wind tunnel16. A three-component (lift, drag, pitch) proprietary aerodynamic wind tunnel balance which was located below the test section permitted the cricket ball to be located in the air stream, and the ensuing lift and drag forces were digitally measured with an uncertainty that depended on the flow Reynolds number.
2.2 Lift drag and side force measurement
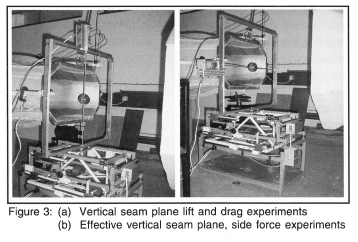
The aerodynamic forces on the ball were required to be measured with the minimum interference from any supporting sting or drive mechanism required to spin the ball. Figure 3 shows the square frame that was constructed to support both the stationary and spinning ball. It is formed from four aluminium bars 700 mm long by 30 mm wide by 15 mm deep. The bars are screwed together at their corners with corner blocks to provide added rigidity. The two vertical bars have roller bearings housed in them and these provide support for a 6 mm diameter 720 mm long rotating steel shaft on which the cricket ball is mounted. A 40 W variable speed drive motor is supported on a bracket attached to one of the vertical legs of the frame and a flexible coupling between the motor shaft and the ball shaft allows the ball to be rotated at any desired spin speed. A short stub sting could be screwed onto a vertical or horizontal bar of the frame, which permitted the whole assembly to be mounted on the aerodynamic balance with the ball shaft either vertical or horizontal. This construction ensured that only the ball and short lengths of the ball support shaft were exposed to the wind tunnel air stream, the remainder of the support frame being outside of the air stream. When mounted on the balance, the lift and drag forces were measured to an uncertainty of 0.05 N and 0.02 N respectively.
2.3 Cricket balls
The four cricket balls used were standard two-piece, 156 gram, 71 mm diameter, solid hide red balls manufactured by A.G. Thomson. There were six rows of stitches that protruded approximately 2 to 3 mm above the smooth surface, while the actual seam where the two halves of the cover joined, was approximately 2 mm above the smooth surface. Two of the balls had one half surface artificially roughened with emery cloth to simulate a used ball. Each all-smooth (new) and roughened ball had a hole drilled through its centre and perpendicular to the plane of the seam, and also one drilled through the centre in the plane of the seam, such that the ball was a tight push fit on the support shaft.
3. Experimental Method
The experiments are divided into those for stationary and rotating balls. The total measured drag is made up from the drag of the ball itself plus the tare drag of the supporting steel shaft. For both the vertically and horizontally mounted balls the tare drag was determined by spanning the shaft across the wind tunnel air stream with the ball held in front of, but just separated from it so that it did not touch the shaft. The drag and lift force on the shaft alone were then recorded over the wind speed range 0 to 40 m/s.
3.1 Stationary ball experiments
The new stationary ball was mounted on the vertical support shaft as in figure 3a with the seam plane lying in the vertical x-y plane with γv = 0°. The lift and drag forces were then recorded for a wind speed range of 6 < U < 40 m/s in 2 m/s increments. This was repeated for selected seam plane angles in the range 5° < γy < 90°. For the measurement of the corresponding side force, the frame was turned so that the support shaft lay horizontally across the air stream as in figure 3b. Commencing with the seam plane lying in the horizontal x-z plane, it was incremented clockwise in the range 5°< γv < 90° until it lay in the vertical y-z plane, the lift and drag forces being measured over the 6 to 40 m/s wind speed range for each angular increment as before.
For the roughened ball, the above procedure was repeated, with the upstream projected areas of both the smooth and roughened surfaces facing upstream being initially the same, but the projected area of the rough surface decreasing as γy increased from zero until only the smooth surface faced upstream when γy = 90°. When measuring the corresponding side forces for the rough ball, the rough surface faced in the positive v-direction with the plane of the seam initially lying in the x-z plane with yz = 0°. The seam plane was then incremented clockwise in the range 5° < γz < 90° and also anti-clockwise in the range -5°< γz < -90°, the smooth and rough surfaces facing upstream, when γz = 90° and γz = -90° respectively.
3.2 Spinning ball experiments
The all-smooth and roughened ball were first spun about the z-axis (figure 3b) with the seam plane lying in the vertical x-y plane with γy. = 0°. Each ball was spun in both the clockwise (backspin) and anti-clockwise (topspin) directions at selected spin rates up to 14.5 rps and the lift and drag again measured over the speed range 6 < U < 40 m/s in 2 m/s increments.
The effective side force was measured by spinning the ball about the vertical y axis (figure 3a) with the seam plane lying in the x-z plane with the roughened surface facing the positive v-direction. For the same increments in wind speed, similar increments in spin speed, and for clockwise and anti-clockwise rotation, lift and drag forces were again measured.
4. Results and Discussion
The data is presented as lift, drag and side force coefficients (Cz, Cd, Cs) for the ball over the Reynolds number range 50000 to 200000 corresponding to the velocity range of 12 to 40 m/s. This will allow the data to be applied to the ball flight at any altitude. Some discreet lift, drag and side force data is included where appropriate. It is noted that a force coefficient remaining constant with increasing Reynolds number implies that the force on the ball is increasing as the square of the wind velocity, so care must be taken not to interpret an increasing or decreasing force coefficient as an increase or decrease in the absolute force, other than at a fixed Reynolds number. The force coefficient could decrease between wind speeds even though the force itself increases.
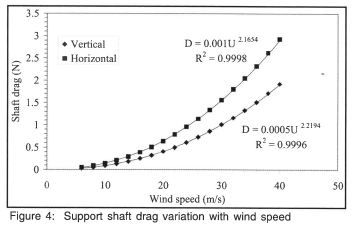
The drag forces on the horizontal and vertical shafts with the ball detached from it are shown in figure 4. A power curve fit shows that each is approximately parabolic with highly acceptable R2 values. The shaft drag at any particular velocity calculated from the curve fit equations was subtracted from the combined ball and shaft drag measurements to give the actual drag on the ball. There was no measurable difference in the shaft drags when they were spinning, and no measurable lift on either the static or spinning shafts.
4.1 Stationary new ball
The net Cd of the ball along the x-axis is shown in figure 5.
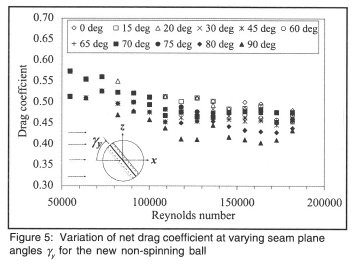
At wind velocities below about 22 m/s (Re ≈ 100000) the seam angle has little effect on the drag, but at higher velocities, increasing the seam angle systematically reduces the drag. For a 90° seam angle at 36 m/s (Re ≈ 163000), the decrease in drag coefficient from that at 0° is approximately 20 %. With the seam plane vertical, the pressure distribution on either side of the horizontal x-z plane is a mirror image which resulted in no net lift force either positive or negative in the vertical y-direction. The side force coefficient along the z-axis is shown in figure 6 for different vertical seam plane angles.
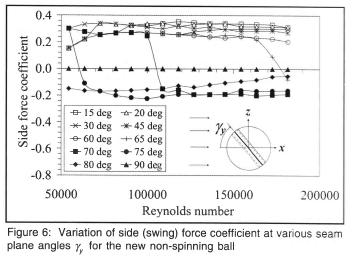
At zero seam angle there was no side force for all wind speeds. This is because of symmetry of the flow and hence the pressure distribution on either side of the x-y plane. For other seam angles the flow is asymmetrical and a side force in the z-direction ensues. Between 15° and 60°, Cs remains sensibly constant, but at 65°, 70° and 75° it suddenly reduces to a negative value of -0.2 at velocities of 36, 22 and 12 m/s respectively, i.e. the ball undergoes reverse swing. This is surprising as it is generally accepted by players and commentators that reverse swing usually occurs only after about thirty to forty 'overs' when the new ball has become roughened on one side of the seam. At 80° the side force is negative at all wind speeds but lower in magnitude than for the 70° and 75° seams with a tendency to approach zero as the velocity is further increased, until at 90° the seam plane is lying in the y-z plane with the flow again being symmetrical about the vertical x-y plane. The positive side force at all velocities up to 60° seam angle is due to boundary layer flow variations. The boundary layer remains laminar on the +z surface up to the seam until it reaches the seam when it is then tripped by the seam into a turbulent boundary layer. The consequence of this is a reduction of pressure on the +z surface caused by the boundary layer remaining attached as a turbulent one for a greater distance around the remainder of the +z surface. On the smooth -z side of the ball the laminar boundary layer is not affected by the seam and separates relatively early around that surface, to give a higher relative pressure on that surface. The net result is a positive z-direction side force.
The reverse swing that occurs between seam angles of 65° and 90° is also due to laminar boundary layer separation now occurring on the smooth +z side of the ball before the seam is reached. Since the seam is angled and recedes from the flow around the surface, the final pressure distribution is due to a complex interaction between the separation point and the local seam location.
4.2 Spinning new ball
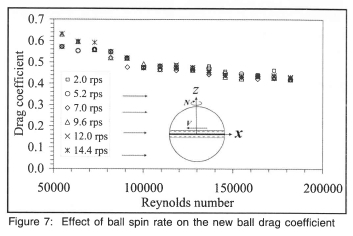
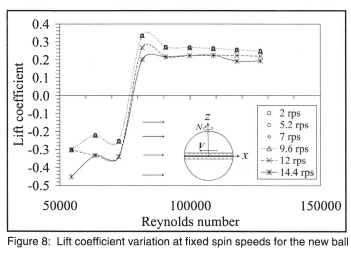
The drag coefficient for the new topspin ball with the seam lying in the vertical x-y plane, is shown in figure 7 for topspin where it is seen to be weakly dependent on high spin speeds. Further, similar drag values were obtained for backspin. In figure 8, with topspin applied, the lift coefficient curves show two distinct regions. For all spin speeds, as the ball velocity increases, the lift is negative until at a velocity of approximately 17 m/s (Re ≈ 80000) it undergoes a step change to a positive lift of approximately the same magnitude. The almost constant value of Cl at higher velocities is indicative of the lift increasing with the square of the velocity. The lift force is the same for spin speeds up to 9.6 rps, and only above this value does the spin speed have any effect on Cl. Because of flow symmetry on either side of the vertical x-y plane, there was no net side force on the ball.
4.3 Stationary roughened ball
The drag coefficients for positive values of seam plane angle γy are shown in figure 9 and are seen to be slightly lower than for the new ball of figure 5.
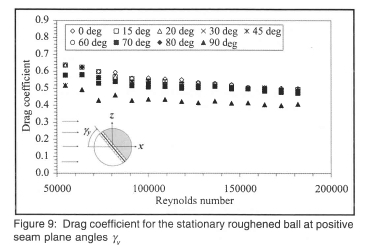
The most notable difference is that although the area of roughness exposed to the free stream is decreasing as γy increases, it has almost no effect on the drag until only the smooth surface up to the seam line faces upstream, the seam then lying in the y-z plane with γy = 90°. Although Cd for the smooth and roughened ball were expected to be the same at 40 m/s when γy = 90°, there is a 6 % difference which is within acceptable experimental error. Although the pressure distributions on the surfaces on either side of the vertical seam are different due to the different surface roughnesses, when resolved perpendicular to the horizontal x-z plane, they are mirror images above and below that plane and should therefore in theory cancel each other to give zero net lift. In practice it was found that a weak and variable lift occurred, which are attributable to non-uniform surface roughness elements and manufacturing imperfections. In comparing figures 10 and 6, the effect of surface roughness on the side force for positive γy, is immediately evident.
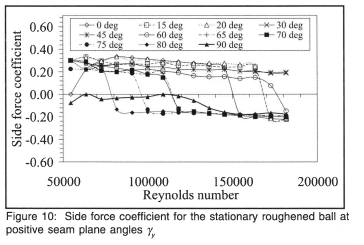
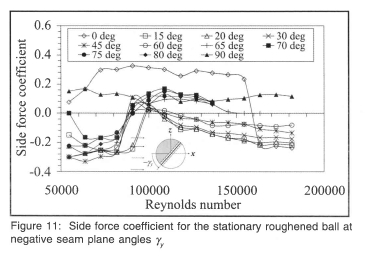
In figure 6, for small seam angles and notably even at zero seam angle, a substantial side force exists until a particular Reynolds number is attained, when it becomes negative, i.e. reverse swing occurs. For the 0° seam angle at all Reynolds numbers, the boundary layer over the smooth side is laminar and therefore separates early around that surface. Reverse swing occurred at different critical Reynolds numbers as the seam angle changed and can be explained by the angle of the seam and the size of the surface roughness elements together playing an important part in the boundary layer flow regime. Reverse swing occurred at seam angles of 0°, 15° and 20° although high wind stream velocities were required to achieve this. This is often found in practise when fast bowlers achieve reverse swing after about 30 to 40 'overs' of ball use, when a surface on one side of the seam plane is highly roughened while the other is maintained as smooth as possible. A further increase in seam angle caused reverse swing to disappear, the swing becoming positive, until once again manifesting itself at the 60° seam angle and occurring at progressively lower wind velocities as the seam angle increased further. The implication of this is that provided the seam angle is large enough, even the slow bowler can achieve reverse swing of the ball. When yy increases negatively with more of the roughened surface being exposed to the wind stream (figure 11), the side force is predominantly negative other than at 0° and 90°. Between 65° and 80° the forces were extremely unstable after about32 m/s (Re ≈ 14500).
4.4 Spinning roughened ball
As expected, the drag for the spinning ball was the same for topspin and backspin, as well as being independent of the spin speed, and the topspin Cd is shown in figure 12.
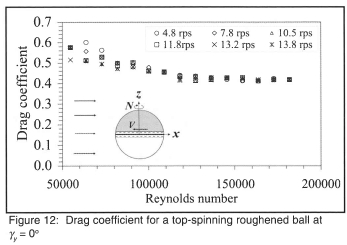
Although it is in general only 5% lower than for the spinning new ball of figure 7, the close grouping of the curves for each regime suggests that the spinning rough surface contributes significantly to the drag reduction.
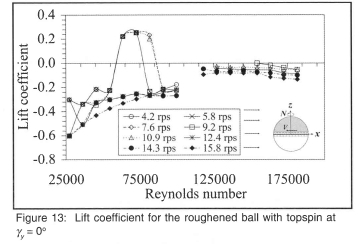
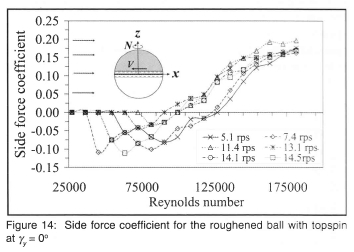
The lift coefficient curves in figure 13 show Cl to be strongly negative at low wind speeds and all spin speeds. At a wind speed of 12 m/s (Re ≈ 54000) the lift becomes positive for the spin speed range 4.2 to 10.9 rps and remains at a constant elevated value until Re ≈ 83000 when it again becomes negative. At spin speeds of 12.4,14.3 and 15.8 rps the negative lift coefficient decreases steadily towards zero. A critical range of spin speeds therefore exists over which unexpected dipping or rising of the bowled ball can occur and this is the range utilised by slow spin bowlers to 'float' the ball. For wind speeds greater than 22 m/s (Re ≈ 100000 ) the lift force became unstable at some Reynolds numbers but the general tendency is for the lift to increase negatively with the square of the wind speed as indicated by the almost constant value of Cl between 11800 < Re < 182000. It is interesting to note that the variation of Cl with Re follows similar trends for all spin speeds. At any given wind speed the spin speed has a significant effect on the side force both in magnitude and direction. In figure 14, the effect of spin at low wind speeds is to induce negative side force. This gradually changes to a positive side force through a combination of extremely complicated boundary layer flow interactions involving the Magnus effect and the movement of the critical boundary layer separation point as the Reynolds number changes. It should be remembered that the spin speed of the ball surface, which induces circulation and the resultant Magnus effect, varies between the full peripheral speed at the seam, to zero at the axis of spin.
5. Error Analysis
An error analysis was performed on the data by the method of Kline and McClintock17 for single sample experiments. Of the independent variables required for the calculation of Cd,Cl and Cs, the density and area were determined through the measurement of pressure, temperature and diameter using standard high sensitivity instruments. The lift, drag and velocity contributed varying uncertainties depending on the wind tunnel velocity. As the velocity decreases towards zero, then since the uncertainty in its measurement remains constant, the uncertainties in Cl, Cd and Cs tend towards infinity. The magnitudes of the uncertainties of pressure, temperature and diameter were of the order 10-5, while those for lift, drag and velocity were of the order 10-3. Since the total uncertainty is given by the square root of the sum of the squares of the individual variable uncertainties, only the uncertainties in lift, drag and velocity measurements were of significance. In figure 5, as the wind speed increased, the uncertainty in the drag progressively decreased until at the maximum wind speed of 40 m/s the measured drag was 1.88 N with an uncertainty of approximately 1%. The maximum measured side force of 1.15 N in figure 6 has an uncertainty of 4 % but smooth trends in all the side force curves of this figure, other than where recognised discontinuities due to boundary layer flow changes occur, support the validity of the measurements.
6. Conclusions
The data curves presented in this paper illustrate the wide variety of forces that can occur on a cricket ball during use. The orientation of the seam, the surface roughness through wear and the degree of spin applied to the ball, all affect the flight of the ball to some degree, and although the absolute values of the forces acting on the ball may at times be small, they can never-the-less lead to significant deviations in its flight trajectory over the length of the playing pitch. These data sets will be used for correlating the results of numerical computational fluid dynamics (CFD) simulations of a cricket ball in free flight and will also be useful to those researchers engaged in flight trajectory prediction and analysis.
Cricket balls are manufactured by numerous commercial companies. Within the prescribed design parameters of size and weight, the height of the primary seam, the number and height of the stitches and the surface characteristics of the outer cover material can vary. Therefore even for from one ball to another, variations in aerodynamic forces may occur and thus the data presented here is only broadly indicative of the aerodynamic coefficients to be expected.
References
1. Achenbach E, Experiments on the flow past spheres at very high Reynolds numbers, Journal of Fluid Mechanics 1972, 54, 565-575. [ Links ]
2. Achenbach E, The effects of surface and tunnel blockage on the flow past spheres, Journal of Fluid Mechanics 1914, 65, 113-125. [ Links ]
3. Lighthill MJ, Laminar Boundary Layers (edited by L Rosenhead.), Clarendon Press, Oxford, 1963.
4. Mehta R and Wood D, Aerodynamics of the cricket ball, New Scientist, 1980,87 (1219), 442 - 447. [ Links ]
5. Mehta R, Aerodynamics of sports balls, Annual Review of Fluid Mechanics, 1985,17,151 - 189. [ Links ]
6. Briggs LI, Effect of spin and speed on the lateral deflection (curve) of a baseball; and the Magnus effect for smooth spheres, American Journal of Physics, 1959, 27 (8), 589 - 596. [ Links ]
7. Watts RG and Sawyer E, Aerodynamics of a knuckleball, American Journal of Physics, 1975, 43 (11), 960 - 963. [ Links ]
8. Frohlich C, Aerodynamic drag crisis and its possible effect on the flight of baseballs, American Journal of Physics, 1984, 52 (4), 325-334. [ Links ]
9. Watts RG and Ferrer R, The lateral force on a spinning sphere: Aerodynamics of a curveball, American Journal of Physics, 1987, 55(1), 40-44. [ Links ]
10. Adair RK, The physics of baseball, Physics Today, 1995, 5, 26-31. [ Links ]
11. Barton, NG, On the swing of a cricket ball in flight, Proceedings of the Royal Society of London A, 1982, 379, 109 - 131. [ Links ]
12. Sherwin K and Sproston JL, Aerodynamics of a cricket ball, International Journal of Mechanical Engineering Education, 1982, 71-79.
13. Sayers AT. and Hill A, Aerodynamics of a cricket ball, Journal of Wind Engineering and Industrial Aerodynamics, 1999, 79, 169-182. [ Links ]
14. Sayers, AT, On the reverse swing of a cricket ball-modelling and measurements, Proceedings of the Institution of Mechanical Engineers Part C, 2001, 215, 45 - 55. [ Links ]
15. Pope A and Harper J J, Low Speed Wind Tunnel Testing. John Wiley, New York, 1966.
16. Sayers AT and Ball DR, Blockage corrections for rectangular flat plates mounted in an open jet wind tunnel, Proceedings of the Institution of Mechanical Engineers Part C, 1982, 197, 259-263. [ Links ]
17. Kline SJ and McClintock FA, Describing uncertainties in single sample experiments, Mechanical Engineering, 1953, 75, 3-8. [ Links ]
Received 6 February 2007
Accepted 8 June 2007
