


Services on Demand
Journal

Article
 English (pdf)
 Article in xml format
 Article references
 Send this article by e-mail
Indicators
Related links
-
 Cited by Google
 -
 Similars in Google
Share

 Permalink
South African Journal of Enology and Viticulture
On-line version ISSN 2224-7904Print version ISSN 0253-939X
S. Afr. J. Enol. Vitic. vol.45 n.1 Stellenbosch 2024
https://doi.org/10.21548/45-1-6148
ARTICLES
Ripening Trends of Vitis vinifera L. cv Sugrasixteen (SABLE SEEDLESS®) Table Grapes at Different Crop Loads and Bunch Sizes
N. ViljoenI; H. H. NieuwoudtI, *; P. YoungI; D.W. ViljoenIII; M. KiddIV; J. H. AvenantII; E. AvenantI
ISouth African Grape and Wine Research Institute, Department of Viticulture and Oenology, Faculty of AgriSciences, Stellenbosch University, Private Bag X1, 7602, Matieland (Stellenbosch), South Africa. nviljoen@sun.ac.za; hhn@sun.ac.za; pryoung@sun.ac.za; avenant@sun.ac.za
IIARC Infruitec-Nietvoorbij, Private Bag X5026, 7599 Stellenbosch, South Africa. janbud@icon.co.za retired 31 October 2022. Independent researcher
IIIExperiCo, Infruitec North Campus, 7599 Stellenbosch, South Africa. daniel@experico.co.za
IVCentre of Statistical Consultation, Stellenbosch University, Private Bag X1, 7602, Matieland (Stellenbosch), South Africa. mkidd@sun.ac.za
ABSTRACT
Crop load and bunch size manipulation are two prominent viticultural practices used in the production of Vitis vinifera L. cv. Sugrasixteen table grapes. However, their respective effects on berry ripening are unknown and were investigated in this study. A split-plot vineyard block design with three different crop loads (low, medium, and high) as the main treatments and two bunch size treatments (small and large) as the subplot factors were used. Weekly berry samples from veraison to harvest from each treatment were analysed for mass, total soluble solids (TSS), titratable acidity (TA), and pH. Data mining established the ripening trends and explored the possibility of estimating optimal harvest dates using EC50 values. Results showed that berries of large bunches had higher average mass than small bunches during ripening. Increased crop loads resulted in berries with lower mass, TSS and TSS:TA ratio, and delayed berry ripening. Conversely, berries from the low crop load increased in mass and accumulated TSS faster during ripening than higher crop loads, reaching EC50 two to four days earlier with accumulation starting to slow down at higher values. EC50 could be used to estimate harvest dates for low to medium crop loads, but not for high crop loads. This study provides the first in-depth analysis of SABLE SEEDLESS® ripening trends concerning crop load and bunch size management. The results have implications for the grape's overall eating quality. The statistical prediction of optimal harvest dates for lower crop loads could have practical benefits for the industry.
Key words: Vitis vinifera L., table grapes, SABLE SEEDLESS®, crop load, bunch size, ripening rate, Y0, EC50.
INTRODUCTION
Sugrasixteen (Vitis vinifera L.), also known as SABLE SEEDLESS®, is considered internationally one of the most important black seedless cultivars with its unique characteristic flavour (Maoz et al., 2019). The berry size, total soluble solids (TSS), and skin colour of the South African SABLE SEEDLESS® for the export market are regulated by the Agricultural Product Standards Act of 1990 (Act No. 119, section 4(3)(a)(ii)). However, no set standard for TSS to titratable acidity (TA) ratio for SABLE SEEDLESS® has been published as for several other table grape cultivars intended for export. TSS:TA ratio plays a vital role in consumer preference (Jayasena & Cameron, 2008) and is a key characteristic determining the flavour of table grapes (Maoz et al., 2016). The need arose to scientifically validate the cultivar-specific recommendations regarding TSS and expand the profile of SABLE SEEDLESS® to include TSS:TA ratio. Additionally, the influence of the latter on the unique flavour of SABLE SEEDLESS® warrants further studies.
Furthermore, the timing when table grapes reach commercial ripeness is a critical consideration for producers and exporting companies when selecting final market destinations, which significantly impacts the economic value of a crop. The double sigmoidal growth curve of grape berries has been extensively discussed (Coombe, 1976; Ollat, 2002), indicating that the grape berry goes through a rapid development phase followed by a lag phase and finally, the ripening phase up to harvest. The ability to predict table grape berry ripening from veraison (onset of ripening) to optimal harvest date has been under research. Recent studies endeavoured to predict table grape berry maturity parameters non-destructively (Pigani et al., 2018; Daniels et al., 2019; Ferrara et al., 2022) but estimating the rate of ripening, and optimal harvest date, for table grapes, has received little attention and is still questionable. Novel data mining techniques can be performed to determine ripening trends and possibly predict optimal harvest dates. In agriculture, the term EC50 is used as a statistical estimate to predict pesticides' effective concentration of achieving 50% of maximal control (Liang et al., 2014; Rozman et al., 2010). This statistical equation could be introduced to the table grape berry ripening trend to predict when the berry will reach 50% of optimal maturity.
Numerous scientific studies have focused on the aspects that influence the timing and evolution of chemical parameters during table grape berry ripening and therefore, the final berry quality (Peppi et al., 2006; Jayasena and Cameron, 2008; Singh et al., 2017; Yin et al., 2022). Table grape vineyard management practices are intentionally performed to change final berry quality, for instance crop load manipulation are performed by removing entire bunches from the vine between pre-bloom and pea-size berry, depending on cultivar, to contribute to increased berry mass, total soluble solids, berry colour, and reduces post-harvest decay (Dokoozlian & Hirschfelt, 1995; Benavente et al., 2014; Singh et al., 2017; Söyler et al., 2020). Improved berry set and increased berry size are obtained by girdling ( Söyler et al., 2020; Tyagi et al., 2020), plant hormone applications (Avenant & Avenant, 2006), as well as bunch size shortening or thinning according to the required berries per bunch by cutting the berries from the distal part of the bunches to a specific bunch length (mm) or number of berries per bunch (Benavente et al., 2014; Yin et al., 2022). General viticultural management practices for SABLE SEEDLESS® include crop load manipulation and bunch shortening. However, the effect thereof on the grape berry ripening tempo and flavour development has been under-researched.
The key aspects that influence the economic value of SABLE SEEDLESS® are the berry ripening tempo, influencing harvest date, and if berries reach the required maturity indices coupled with the unique flavour at harvest. Several factors influence berry ripening and final quality. Still, in this study, the focus was on two predominant viticultural practices, namely crop load manipulation and bunch size manipulation (bunch shortening) and the effect thereof on SABLE SEEDLESS®'s ripening tempo. The commercial standard crop load of medium (6000 cartons/ha), as well as the extreme low (3000 cartons/ha) and high (9000 cartons/ ha) crop loads, in combination with small and large bunches were investigated. Weekly sampling was done from veraison to harvest to determine maturity indices and ripening trends over time. Further data mining was performed on the ripening trends obtained for berry mass and TSS to determine the rate of accumulation, thereby statistically estimating when berries reach 50% of potential total accumulation (EC50), and when accumulation starts to slow down and plateau.
MATERIALS AND METHODS
Experimental vineyard layout
This study was performed over two consecutive seasons (2020/2021 and 2021/2022) in a commercial Sugrasixteen (Vitis vinifera L.) vineyard with a record of successfully attaining the required export market parameters for SABLE SEEDLESS®. The vines were grafted onto Ramsey rootstock and planted in 2015 at 3 m x 2 m spacing in De Doorns, Western Cape, South Africa. The grapevines were trained on a gable trellising system. Vineyard management practices for the cultivar and region were applied as recommended by the South African Table Grape Industry (SATI) (Van der Merwe, 2020). The experimental layout was a randomised block design containing 24 experimental units, four vines per unit, replicated in eight blocks. The treatment design was a split-plot design with the main treatments consisting of three different crop loads, and the subplot factors were the two bunch size treatments. The main treatments were performed on each vine of the experimental unit by selecting an even number of small and large bunches per vine and removing the rest to the desired crop load.
SATI recommends that optimal taste and quality of SABLE SEEDLESS® is achieved when working on a crop load factor of six bunches per square meter (Van Der Merwe, 2020). As a result, the optimal crop load is 6000 cartons/ha (cartons represent 4.5 kg commercially packed bunches for the export market), obtained with the recommended bunch size of 600 to 700 g/bunch with 110 berries/bunch and a berry mass of 5.5 to 6.3 g/berry (Van Der Merwe, 2020). However, producers strive to achieve a minimum of 5.0 g/ berry (Sandhills, 2020), 0.5 g/berry lower compared to the 5.5 g/berry as recommended by Van Der Merwe (2020). The three crop load treatments were therefore set out as medium (6000 cartons/ha) with the extremes of low (3000 cartons/ ha), and high (9000 cartons/ha) with cartons representing the commercial standard 4.5 kg packed carton. Bunch sizes consisted of small bunches (80 berries/bunch) and large bunches (120 berries/bunch). As recommended industry practice for the cultivar (Van der Merwe, 2020) both crop load and bunch size manipulation were performed at pea-size berry size (5 - 7 mm diameter) for both seasons. Crop load manipulation was performed on each vine by removing bunches to meet the required crop loads (20 bunches per vine for low crop load; 40 bunches per vine for medium crop load and 60 bunches per vine for high crop load) and shortening bunches by using a scissor and cutting the distal berries from a bunch to the specific number of berries required.
Differences in bunch sizes between seasons
Initially, it was planned to have small and large bunches on the same vine for both seasons. In the first season, a sufficient number of bunches per vine could be trimmed to ensure an equal number of small and large bunches. However, in the second season, only small bunches occurred naturally throughout the trial site, and no sub-treatments of small and large bunches could be applied. The reason for different bunch sizes between seasons could be ascribed to a seasonal effect, but no further investigation was performed in this study.
Grape sampling
From 5% veraison, the onset of ripening, five berries per bunch were randomly selected and cut from bunches, with pedicle attached, to obtain a total of 130 berries (65 berries from small bunches and 65 berries from large bunches) from the four vines per replicate. Grape berry samples were collected weekly from veraison until one week after the commercial harvest date (six weeks - 35 days after veraison) when all the crop loads had reached the minimum TSS of 17°Brix as set out by Act 1990 for SABLE SEEDLESS®.
Fresh berry analyses
A sample consisting of 50 berries from each bunch size for each block replicate (n = 8) was used to determine the average berry mass. Berry samples were pulped, and total soluble solids (TSS) were measured as °Brix with a handheld digital refractometer (PAL-1, ATAGO, Tokyo, Japan). Titratable acidity (TA) and pH were measured by titrating 50 mL juice to end-point 7.0 using sodium hydroxide (Fenoll et al., 2009; Moaz et al., 2016) with a Metrohm, 785 DMP Titrino instrument (CH-9101 Herisau, Switzerland). TSS:TA ratios were calculated.
Yield and actual cartons/ha as measured at harvest
The actual number of 4.5 kg cartons packed for each treatment was determined at harvest to validate the experimental layout. All the bunches on each vine per replicate were removed and separated according to sub-treatment categories. Hereafter, the bunches from each sub-treatment were counted, weighed, and packed according to commercial standards in 4.5 kg cartons. The number of cartons was counted and converted to the number of cartons/ha for each sub-treatment.
Ripening trend analysis
Exponential (least square) growth curves (Figure 1) were fitted to investigate how berry mass and TSS increased over time for the different treatments. Goodness-of-fit were indicated by confidence intervals of the parameter estimates. The ripening trends were calculated using the following formula:
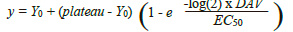
The following three parameters were estimated from the formula, namely: Y0 - berry mass or TSS at the start of sampling; plateau - where berry mass or TSS accumulation starts to slow down; and EC50 - the number of days for the berry mass and TSS to reach 50% of the mass or TSS from Y0. DAV denotes the number of days after veraison. Growth curves were fitted via R Statistical Software drc package version 3.0-1 (Ritz et al., 2015).
Statistical analysis
A mixed model ANOVA was conducted with plots as random effects and crop load, bunch size and days after veraison (with all interactions) as fixed effects. Normality was checked by inspecting normal probability plots and was judged to be acceptable. Fisher's least significant difference (LSD) was used for post hoc testing. Analysis was done using the R Statistical Software ImerTest package version 3.1-3 (Kuznetsova et al., 2017). Statistica graphics facilities were used to make graphs from the results produced in R.
RESULTS AND DISCUSSION
Comparison of predicted to actual cartons/ha
The exact number of cartons/ha was not obtained as initially intended (Figure 2) since prediction calculations were based on industry standard bunch size (small) and crop load (medium). However, significant statistical differences between extreme crop loads were found, and therefore the treatments will be assigned as low, medium, and high crop load treatments. In the first season, the small bunch size treatments resulted in similar cartons/ha as intended, but the large bunch size treatments almost doubled the intended cartons/ha.
Ripening and maturity indices
Grape Berry mass
During the first season, crop load and bunch size significantly impacted the berry mass during ripening (Table 1). From the start of sampling to harvest, 0 to 35 days after veraison (DAV), statistical differences in berry mass between crop loads and between bunch sizes were found. Further data mining was done to determine the trendlines of berry mass increase (rate of accumulation) (Figure 3 a) from the start of sampling, represented by Y0 (Figure 3b) until increase in berry mass stopped (Figure 3d). The trendline between Y0 and when berry mass stopped increasing was used to calculate the number of days it took for berries to reach 50% of the maximal mass (EC50) (Figure 3c). At the start of sampling, 0 DAV, the initial mass (Y0) of the berries from the low crop load was significantly higher compared to the medium and high crop load treatments (both bunch sizes) (Figure 3b). This indicated that berry growth during the development phase (before veraison) is influenced when the crop load decreased from medium to high (40 to 60 bunches/ vine) to low crop load (20 bunches/vine) at 5 mm berry size. In contrast, Dokoozlian & Hirschfelt (1995) did not observe any differences in berry mass at the start of ripening when the crop load of Flame Seedless was reduced from 45 to 30 bunches/vine at either berry set or two and four weeks after berry set. This contrast could be ascribed to either the different cultivar, trellising system and climatic conditions compared to present study.
Furthermore, in both seasons of this study, the separation in trendlines of the different crop loads between 0 to 14 DAV indicates that berries for low crop load rapidly increase in berry mass between 0 and 7 DAV, followed by berries from medium crop load increasing between 7 to 14 DAV with berries from high crop load showing the slowest growth trend (Figure 3a). Low crop load resulted in berries with the highest mass throughout ripening compared to medium and high crop loads. The findings correspond to previous research indicating that crop load reduction leads to higher berry mass (Dokoozlian & Hirschfelt, 1995; Fallahi et al., 2017; Singh et al., 2017; Söyler et al., 2020). The higher berry mass in season two compared to season one at Y0 could indicate that a uniform bunch size across the vine results in less competition for resources between berries. As a result, nutrients can be located evenly throughout the bunches on the vine.
Opposed to the crop load effect, bunch size manipulation did not significantly influence berry mass during initial berry development up to veraison since no significant differences in berry mass were found within the crop load treatments at Y0. Nevertheless, berries from large bunches tend to have higher berry mass compared to berries from small bunches across the three crop load treatments at Y0. However, bunch size manipulation significantly affected berry mass during berry ripening since berries from larger bunches had significantly higher berry mass throughout ripening, and reached a higher berry mass compared to small bunches when increase started to slow down. A similar trend was found in a study by Fallahi et al. (2017), indicating that bunch shortening results in higher berry mass. However, in contrast, Benavente et al. (2014) found that small bunches (80 berries/bunch) had higher berry mass compared to large bunches (160 berries per bunch) of Thompson Seedless grapes. They did not report at what crop growth stage crop load and bunch size manipulation were performed. Furthermore, Yin et al., (2022) found that bunch shortening at pea-size berry size (5-7 mm) did not affect berry mass at harvest of two cultivars (Baoguang and Cuiguang) produced under protected cultivation in China.
The rate of accumulation trendlines was used to predict at what berry mass the increase will slow down, and these values were compared to the actual values obtained from sampling. In both seasons, berries from lower crop load reached the producer-recommended 5.0 g/berry mass by 21 DAV and medium crop load at 28 DAV, while the predicted mass (between 5.5 to 6.1 g/berry) for both crop loads was reached at 35 DAV. Berries from the high crop load reached the recommended berry mass by 35 DAV but had not yet reached the predicted mass when increase will start to slow down (5.1 to 5.9 g/berry) in this study. This indicates that the berries from high crop loads tend to grow slower and reach the potential final mass later than the lower crop loads.
Consequently, since berries from low crop load reached a higher berry mass before the increase started to slow down, it can be concluded that the larger the berry at the start of veraison (Y0), the greater the potential of rapidly reaching higher berry mass before reduction in berry mass increase is observed.
From the Y0 and plateau values, the EC50 was statistically calculated to predict the number of days after veraison (DAV) berries will reach 50% of the potential final berry mass (Figure 3c). In the first season, significant differences in EC50 were found between crop load treatments, with berries from the lowest crop load reaching EC50 earlier than higher crop loads. A similar trend was observed in the second season; however, differences were not significant. Bunch size also tends to influence the rate at which berry mass increases since berries from small bunches tend to reach EC50 earlier compared to berries from large bunches across the three crop loads. However, the differences were not significant within a crop load treatment.
In both seasons, low crop load reached EC50 between 7 to 11 DAV, one day earlier than the medium crop load (8 to 12 DAV). However, in the first season the high crop load reached EC50 between 12 to 16 DAV, 5 days later, compared to the low crop load. In the second season, the berries from high crop load reached EC50 earlier at 8.5 to 12.3 DAV, only one day later compared to low and medium crop loads. In both seasons, the EC50 graphs display greater variability in berry mass for the high crop load with a 95% confidence level line extending over 4 days compared to 3 days for low and medium crop loads.
Furthermore, it was found that the number of days predicted by EC50 could be used to determine when berries will reach the recommended 5.0 g/berry by multiplying the predicted EC50 value by two. The calculated predicted values were compared to actual values obtained during sampling (Table 1). For both low and medium crop loads, the recommended berry mass was reached within the predicted period. However, the recommended berry mass for berries from high crop load was reached one to seven days later than the predicted period. The trends found for both seasons indicate that predictions are more accurate with lower crop loads than with higher crop loads. This could be due to the variability in berries for higher crop loads.
Total soluble solids (TSS)
In both seasons, the increase in TSS accumulation trends showed similar trends to berry mass (Figure 4). In the first season berries from low crop load with small bunches had significantly higher TSS at Y0 than berries of high crop load with large bunches (Figure 4a). In the second season, no significant differences in the TSS levels were found at Y0 (Figure 4d), which agrees with the study done by Dokoozlian & Hirschfelt (1995), who also found no difference in TSS in Flame Seedless berries between different crop load treatments at start of ripening. However, the TSS values were higher at Y0 for all the crop loads (7.0 to 8.7 °Brix) in the second season compared to the first season (5.5 to 8.0 °Brix), indicating that during the second season, berries could have started to accumulate sugars a few days earlier.
In the first season, the berries from small bunches tend to have a more rapid accumulation rate compared to berries from large bunches (Figure 4a). However, bunch size had no continued significant effect on TSS accumulation during ripening (except at 7 and 21 DAV) (Table 2). Contradictory results were found in the study by Yin et al. (2022), where significant differences were found in TSS between the different size bunches for two table grape cultivars, Baoguang and Cuiguang. This could be because of the final number of berries per bunch in Yin et al. 's (2022) study, namely 30 to 60 berries per bunch, whereas the current study had 80 to 120 berries per bunch. This could indicate that the removal of more berries may potentially have a greater impact on TSS accumulation of SABLE SEEDLESS®.
Like Y0 in the first season, significant differences were found when berries reached EC50 from low crop load with small bunches compared to high crop load with large bunches. Berries from small bunches reached EC50 one to two days earlier compared to the large bunches. Similar to the EC50 values recorded for berry mass, low crop loads reached EC50 at 8 to 13 DAV (both bunch sizes), one to two days earlier than medium crop load (9 to 14 DAV for both bunch sizes), and two to three days earlier than high crop loads (10 to 16 DAV for both bunch sizes). In the second season, only small bunches were produced, and the berries took 1-2 days longer to reach the EC50 of the previous seasons' small bunches. Berries on small bunches from the second season reached EC50 in similar time periods compared to the berries from large bunches for the respective crop loads compared to the previous season. The delay in reaching EC50 in the second season for berries from small bunches could be ascribed to the mass difference between berries since the berries weighed on average 0.21 g/berry more compared to the first season. The increases in mass (and therefore berry size) could have influenced TSS in berries.
Significant differences in TSS were found between crop loads when reduction in the accumulation curves were observed (Figure 4c). TSS accumulation started to slow down between 19.6 and 21 °Brix for berries from the low crop load, between 18.7 and 20.5 °Brix for medium crop load, and between 17.6 and 19.8 °Brix for berries from high crop load (both bunch sizes) (Figure 4). In the second season, the TSS accumulation slowed down 2.0 °Brix increments higher compared to the first season for the corresponding crop loads (Figure 4c). In the first season, berries from the three crop loads reached the predicted TSS at 35 DAV, but in the second season, the berries from medium and high crop loads had not yet reached the predicted TSS.
In both seasons, significant differences in TSS were found between crop load treatments during ripening from 7 until 35 DAV, with berries from the low crop load, with higher berry mass, reaching higher TSS compared to medium and high crop load berries (Table 2). This corresponds to previous studies also indicating that berries from lower crop loads resulted in higher TSS at harvest (Sun et al., 2012; Fallahi et al., 2017; Singh et al., 2017; Söyler et al., 2020).
The predicted harvest date for low and medium crop load using EC50 were compared to the actual TSS measured. The actual TSS °Brix values measured during sampling were used to confirm if the harvest date can be predicted by using the equation as described in the berry mass section by multiplying the EC50 value by two. The predicted harvest dates for low crop load ranged between 20 to 22 DAV, and actual TSS met required standards (above 17 °Brix) between 21 to 28 DAV. Similar to medium crop load, berries reached the required TSS between 21 and 28 DAV compared to the prediction of 22 to 24 DAV. The high crop load reached the required TSS between 28 and 35 DAV, which was later compared to the predicted 25 to 27 DAV. Similar to the predictions for berry mass, the predictions of TSS by using the equation of EC50 multiplied by two did not correspond to actual measurements for the higher crop load. This difference could be ascribed to the variability in TSS of berries from high crop loads.
In both seasons, the berries from the lower crop load reached the required TSS (17 °Brix) a week earlier than the medium crop load and two weeks earlier than the high crop load. Previous studies also indicated that the differences in crop load influenced ripening trends with berries from vines with fewer bunches ripening earlier compared to vines with more bunches (Dokoozlian & Hirschfelt, 1995; Singh et al., 2017; Söyler et al., 2020). Even though, in this study, the required mass and TSS parameters were reached in one-week intervals between crop loads, the question arises whether the prominent muscat flavour of SABLE SEEDLESS® has developed within the same time frame.
Titratable acidity (TA) and pH
Similar trends for TA and pH were found between the different crop loads in both seasons. TA declined rapidly from 27 g/L at 0 DAV to below 4.5 g/L at 35 DAV (Figure 5). No significant differences in TA were found between the crop loads from 21 to 35 DAV Crop load did not have any significant impact on pH during the ripening period, as well. Previous studies also found that crop load manipulation did not affect TA or pH (Dokoozlian & Hirschfelt, 1995; Sun et al., 2012; Söyler et al., 2020).
Bunch size (in the first season) had no significant effect on TA and pH, and therefore bunch size data is not presented in Figure 5. Similarly, Yin et al. (2022) found that a change in bunch size, early on in berry development stage, did not impact TA but altered the pH of berries at harvest. The change over time in TA and pH could be due to a dilution effect as berry size increase, malic acid is used or converted from malic acid to glucose and degradation of acids (Ramos & Romero, 2017).
TSS: TA ratio
In the first season significant differences in TSS: TA ratio were found from 7 DAV between crop load treatments (Table 3). TSS had the greatest impact on the ratios. Even though similar trends were observed in the second season, the TSS: TA ratios for each respective crop load were higher. The lowest crop loads tend to be associated with a rapid increase in TSS, lower TA, and, therefore, higher TSS:TA ratio during ripening and at harvest, compared to the medium and higher crop loads. Contrary to previous findings (Yin et al., 2022), in this study bunch size manipulation had no effect on TSS:TA ratio for both seasons. In both seasons the TSS:TA ratio ranged between 28 and 38 for the three crop loads at 28 DAV and increased to above 40 at 35 DAV. Under Egyptian conditions SABLE SEEDLESS® is harvested when TSS:TA ratios reach 40 to 45 (Mohamed & Khaiery, 2017) which corresponds to the TSS:TA values found in the current study at 35 DAV. Jayasena & Cameron (2008) found the TSS:TA ratio to be a better indicator of consumer demand since the demand for Crimson Seedless table grapes increased by 54% once the TSS: TA ratio increased from 20 to 40. Therefore, further studies could be conducted to determine if the desirable muscat flavour of SABLE SEEDLESS® is correlated to the TSS:TA ratio and at what ratio the flavour becomes most prominent. The TSS:TA ratio parameter could be an important criterion to help determine the optimal timing to harvest SABLE SEEDLESS®.
CONCLUSIONS
Crop load and bunch size manipulation altered the ripening trends of SABLE SEEDLESS®, as well as the timing when berries reached the maturity indices required for the export market. Further data mining also proved beneficial since optimal harvest dates for low to medium crop loads could be predicted. This could influence harvest maturity and, thereby, the final quality and the sensory characteristics of SABLE SEEDLESS® berry. It is still not known how these parameters (reported in this study) relate to the unique Muscat flavour of SABLE SEEDLESS®.
Bunch size manipulation did not enhance the final berry TSS or TSS:TA ratio, and smaller bunches resulted in smaller berries (lower berry mass). Therefore, further research is required to establish if this viticultural management practice is needed for SABLE SEEDLESS®. No combination effect of crop load and bunch size was found for berry mass, indicating that crop load have the greatest impact on SABLE SEEDLESS® berry development. Grapes produced at a lower crop load tend to reach the required quality parameters earlier than the higher crop loads and could be distributed to the market earlier. The potential economic impact on the value per carton entering the market a day to week earlier should be further explored. Even though crop load tends to influence SABLE SEEDLESS® ripening trends, causing berries to reach the required maturity indices earlier, it is still to be ascertained whether the optimum flavour developed within a shorter period and if it is correlated to TSS and TSS: TA ratio.
The prediction models obtained in this study indicated that berry development and ripening, regarding berry mass and TSS, can be calculated using the Y0, EC50 and plateau (when accumulation starts to slow down) values obtained from the rate of ripening curve for low to medium crop loads. The ripening trends can assist table grape producers in employing precision agriculture practices and farming sustainably since it will enable producers to plan and produce table grapes at specified berry mass (size) and TSS for the specific export market the grapes are destined to. The use of the ripening trends to predict EC50, and when berries will be harvest-ready, is a novel estimation technique in the table grape industry. Scientific-based predictions will allow producers to estimate when berries will reach the required maturity indices and, thereby, commercial ripeness. Additional research is required to establish the relationship between berry TSS, TSS:TA ratio and the unique desirable Muscat flavour of SABLE SEEDLESS®.
LITERATURE CITED
Avenant, J. H., & Avenant, E., 2006. Effect of gibberellic acid and CPPU on colour and berry size of 'Redglobe' grapes in two soil types. Acta Hortic. 727, 371-380. https://doi.org/10.17660/ActaHortic.2006.727.44 [ Links ]
Benavente, M., Callejas, R., Reginato, G., & Peppi, C., 2014, Effect of crop load and cluster thinning according to its shape on cluster mass and yield on "Thompson Seedless" Table Grapes. Acta Horticulturae, 1058, 145-150. Sandhills, De Doorns, 2020. Bronkhorst, B, Roodezandt farm, Personal communication. [ Links ]
Coombe, B.G., 1976. The development of fleshy fruits. Ann. Rev. Pl. Phys. 27, 207-228. [ Links ]
Daniels A. J, Poblete-Echeverría C., Opara U. L., and Nieuwoudt H. H., 2019. Measuring Internal Maturity Parameters Contactless on Intact Table Grape Bunches Using NIR Spectroscopy. Front. Plant Sci. 10:1517. https://doi.org/10.3389/fpls.2019.01517 [ Links ]
Dokoozlian, N. K., & Hirschfelt, D. J., 1995. The influence of cluster thinning at various stages of fruit development on Flame Seedless table grapes. Am. J. Enol. Vitic., 46, 429-436 [ Links ]
Fenoll, J., Manso, A., Hellin, P., Ruiz, L. & Flores, P., 2009. Changes in the aromatic composition of the Vitis vinifera grape Muscat Hamburg during ripening. Food Chemistry 114: 420-428. [ Links ]
Ferrara, G., Marcotuli, V., Didonna, A., Stellacci, A. M., Palasciano, M., Mazzeo, A., 2022. Ripeness Prediction in Table Grape Cultivars by Using a Portable NIR Device. Horticulturae 8, 613.https://doi.org/10.3390/horticulturae8070613 [ Links ]
Fallahi, E., Tehranifar, A., & Gharaghani, A., 2017. Cluster management to improve berry quality in young 'Alborz' table grape in the intermountain West Region, USA,International Journal of Fruit Science, 17:4, 349-357. https://doi.org/10.1080/15538362.2017.1315629 [ Links ]
Jayasena, V., & Cameron, I., 2008. °Brix/acid ratio as a predictor of consumer acceptability of Crimson Seedless table grapes. Journal of Food Quality, 31, 736-750. [ Links ]
Kuznetsova A., Brockhoff P.B., & Christensen R. H. B., 2017. lmerTest Package: Tests in Linear Mixed Effects Models. Journal of Statistical Software, 82(13), pp. 1-26. https://doi.org/10.18637/jss.v082.i13 [ Links ]
Liang, H., Li, J., Di, Y., Zhang, A., & Zhu, F., 2015. Logarithmic Transformation is Essential for Statistical Analysis of Fungicide EC50 Values. J Phytopathol 163, 456-464. [ Links ]
Moaz, I., Beno-Moualem, D., Kaplunov, T., Lewinsohn, E. & Lichter, A., 2016. Uneven distribution of flavour components in table grape berries. Australian Society of Viticulture and Oenology 22, 3, 343-349. [ Links ]
Moaz, I., De Rosso, M., Kaplunov, T., Chalupowicz, D., Dalla Vedova, A., Lewinsohn, E., Flamini, R., & Lichter, A., 2019. Effect of controlled atmosphere on metabolites associated with quality of 'SABLE SEEDLESS®' grapes. Acta Hortic. 1256. 549-554. https://doi.org/10.17660/ActaHortic.2019.1256.78 [ Links ]
Mohamed, G. A., & Khaiery, A. T., 2017. Description and evaluation of some newly introduced grape cultivars under Egyptian conditions. Middle East Journal of Applied Sciences, 7(4), 1101-1109. https://doi.org/10.21608/jacb.2021.187453 [ Links ]
Ollat, N., Diakou-Verdin, P., Carde, J. P., Barrieu, F., Gaudillère, J. P., & Moing, A., 2002. Grape berry development: a review. Journal international des sciences de la vigne et du vin, 36 (3). [ Links ]
Peppi, M. C., Fidelibus, M. W., & Dokoozlian, N., 2006. Abscisic acid application timing and concentration affect firmness, pigmentation, and color of "Flame Seedless" grapes. In Hortscience, 41, 6. [ Links ]
Pigani, L., Vasile Simonea, G., Focab, G., Ulricib, A., Masinob, F., Cubillana-Aguilerad L., Calvinib R., Seebera, R., 2018. Prediction of parameters related to grape ripening by multivariate calibration of voltammetric signals acquired by an electronic tongue. Talanta, 178, 178-187. https://doi.org/10.1016/j.talanta.2017.09.027 [ Links ]
Ritz, C., Baty, F., Streibig, J.C., & Gerhard, D., 2015. Dose-Response Analysis Using R. PLoS ONE 10(12): e0146021. https://doi.org/10.1371/journal.pone.0146021 [ Links ]
Rozman, K.K., Doull, J., & Hayes, W.J., 2010. Chapter 1 - Dose and time determining, and other factors influencing, toxicity. In: Krieger, R. (Ed.), Hayes' Handbook of Pesticide Toxicology (Third Edition), Ed. Academic Press, New York, pp. 3-101. https://doi.org/10.1016/B978-0-12-374367-1.00001-X [ Links ]
Singh, S., Arora, N. K., Gill, M. I. S., & Gill, K. S., 2017. Differential crop load and hormonal applications for enhancing fruit quality and yield attributes of grapes var. Flame Seedless. Journal of Environmental Biology, 38, 5, 713-718. https://doi.org/10.22438/jeb/38/5/MS-227 [ Links ]
Söyler, K., Altındişli, A., & Işçi, B., 2020. The effects of different crop load and summer pruning application on grape yield and quality parameters of 'Mevlana' cultivar (Vitis vinifera L.). Erwerbs-Obstbau, 62, 125-130. https://doi.org/10.1007/s10341-020-00519-5 [ Links ]
Sun Q., Sacks G. L., Lerch S. D., & Vanden Heuvel J. E, 2012. Impact of Shoot and Cluster Thinning on Yield, Fruit Composition, and Wine Quality of Corot noir. Am. J. Enol. Vitic. 63, 1. [ Links ]
Tyagi, K., Maoz, I., Lewinsohn, E., Lerno, L., Ebeler, S. E., & Lichter, A., 2020. Girdling of table grapes at fruit set can divert the phenylpropanoid pathway towards accumulation of proanthocyanidins and change the volatile composition. Plant Science, 296. https://doi.org/10.1016/j.plantsci.2020.110495 [ Links ]
Van Der Merwe, G., 2020. Guidelines for the preparation of table grapes for export. South African Table Grape Industry (SATI), Paarl. [ Links ]
Yin, Y., Li, M., Jia, N., Sun, Y., Han, B., Liu, C., Liu, S., Zhao, S., & Guo, Z., 2022. Effects of trellis system and berry thinning intensity on vine performance and quality composition of two table grape cultivars under protected cultivation in northern China. Scientia Horticulturae, 299, 111045. https://doi.org/10.1016/j.scienta.2022.111045 [ Links ]
Submitted for publication: October 2023
Accepted for publication: May 2024
* Corresponding author: nviljoen@sun.ac.za
