


Services on Demand
Journal

Article
 English (pdf)
 Article in xml format
 Article references
 Send this article by e-mail
Indicators
Related links
-
 Cited by Google
 -
 Similars in Google
Share

 Permalink
South African Journal of Industrial Engineering
On-line version ISSN 2224-7890
S. Afr. J. Ind. Eng. vol.36 n.4 Pretoria Dec. 2025
https://doi.org/10.7166/36-4-3251
GENERAL ARTICLES
A Framework for Measuring Mental Workloads of Faculty Members and Evaluating Significant Differences Through Integrated Carmen-Q And Fuzzy AHP
T. SametI, *; Y. IbrahimII
IDepartment of Architecture and Urban Planning, Tokat Gaziosmanpasa University, Tokat, Türkiye
IIDepartment of Industrial Engineering, University of Ankara Yildirim Beyazit, Ankara, Türkiye
ABSTRACT
This study evaluates the mental workloads of academic staff in Turkey, and examines the differences based on academic titles. Mental workload, which is critical for occupational health and safety, is assessed using a hybrid approach combining the CarMen-Q mental workload scale and the fuzzy analytical hierarchy process. The scale has four main factors and 29 sub-factors. An original algorithm was developed using fuzzy logic, α-cut, and an optimism index for denazification. The internal consistency of the study is high (α = 0.94). This research presents a novel contribution by integrating fuzzy logic into academic mental workload assessment.
OPSOMMING
Hierdie studie evalueer die kognitiewe werklading van akademiese personeel in Turkye en ondersoek die verskille gebaseer op akademiese titels. Kognitiewe werklading, wat krities is vir beroepsgesondheid en -veiligheid, word beoordeel deur 'n hibriede benadering te gebruik wat die CarMen-Q-kognitiewe werkladingskaal en die vaag analitiese hiërargieproses kombineer. Die skaal het vier hooffaktore en 29 subfaktore. 'n Oorspronklike algoritme is ontwikkel met behulp van vaaglogika, α-snit en 'n optimisme-indeks vir defuzzifikasie. Die interne konsekwentheid van die studie is hoog (α = 0.94). Hierdie navorsing lewer 'n nuwe bydrae deur vaaglogika in akademiese kognitiewe werkladingsassessering te integreer.
1. INTRODUCTION
Occupational health and safety is a field that focuses on reducing workplace risks and creating a safe environment for employees' physical and mental health. It considers not only physical hazards but also mental workload, stress levels, focus capacity, and overall psychological well-being. Measuring mental workload is crucial to determine employees' mental and physical well-being. Despite efforts to come up with one, there is no universally accepted definition of "workload". There are various definitions, such as mental strain experienced during tasks, workload created by perceptual and cognitive activities, and the cost of fulfilling the demands of tasks. Mental workload is a comprehensive concept that encompasses the mental strain resulting from task performance [1].
The literature review found no study that specifically compares the mental workloads of academic staff based on their titles, and no hybrid study using the fuzzy analytical hierarchy process (FAHP) method was identified. In this study, the CarMen-Q scale, a mental workload method developed by Rubio-Valdehita and colleagues (2017), was used. In addition, a hybrid study was conducted by combining the FAHP method, which is a multi-criteria decision-making method, with the CarMen-Q mental workload measurement method. The priority values of the mental workloads of academic staff were determined on the basis of real data analysis, and significant differences were evaluated. Therefore, this study was conducted to fill the gap identified in the literature, to provide guidance for future studies, and to offer recommendations.
This study presents an algorithm proposal that combines fuzzy logic, multi-criteria analysis methods, and the CarMen-Q method of determining mental workload, including the FAHP method, in the literature. The proposed algorithm was developed to measure the priority values of mental workloads for academic staff at universities in Tokat, Ankara, and Sivas, Turkey, and to identify significant differences between their academic titles and their mental workloads. In the application process, the factors and sub-factors used to determine mental workload were compared in pairs using triangular fuzzy numbers. The fuzzy geometric mean method was used to analyse the matrices. Mental workloads were evaluated using linguistic variables, and the total fuzzy priorities for each academic staff member were determined. These priority values were defuzzified using an α-cut and optimism index-based denazification process, and the academic staff were ranked on the basis of their mental workloads using normalised values. The α-cut method was used in the denazification phase to increase the representation degree of the defuzzified value by applying the α-cut process with different α-cut levels to fuzzy numbers.
This study is organised as follows. section 2 provides a comprehensive literature review on mental workload definitions, measuring techniques, and subjective methods, including previous studies and dimensions. Section 3 discusses the importance of determining mental workload and the points to consider when choosing a measurement method. In addition, the materials and methods are explained, and the CarMen-Q method and the FAHP method used in the study are detailed. In section 4, the research findings and the discussion, the application is implemented, and the mental workload measurements of academics are conducted using the CarMen-Q method. The statistical data obtained from the SPSS 27 package program are provided, and the interpretation of the data is discussed. In section 5, evaluations are made based on the mental workload measurement method used, and the results are shared. The section concludes with a sensitivity analysis - a method to observe variability in results from changing decision-makers' opinions -and provides a comprehensive description of the research. The study concludes by comparing the results based on the socio-demographic characteristics of the participating academics, interpreting the analysis outcomes, and providing recommendations for future research and practice.
2. LITERATURE REVIEW
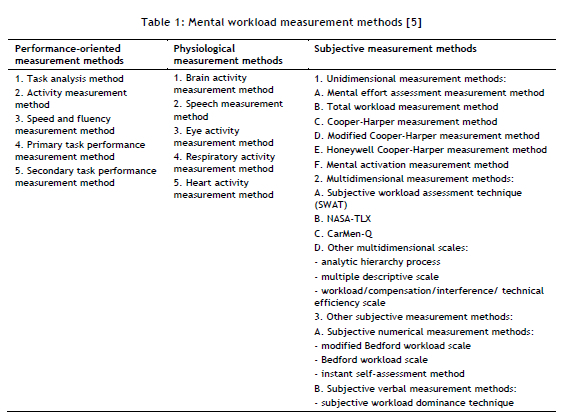
In the literature, the concept of "mental workload" is not as novel as might be expected. Poulton and Brown's 1961 paper [2], "Measuring the unused mental capacity of drivers with a secondary task", and Bainbridge's 1974 study [3], "The difficulties of measuring mental load", are two examples. Interest in defining mental effort and creating assessment tools has increased dramatically since the 1970s. Mental workload is a multidimensional term that has been studied from multiple perspectives, with much research on its measurement and characterisation. According to the literature study, "mental burden" has been defined using a variety of terms, such as cognitive load, cognitive workload, mental effort, and cognitive effort [4]. The methods for measuring mental workload are presented in Table 1.
The NASA-TLX method, commonly used for assessing mental workload, evaluates six dimensions: mental demand, effort, time pressure, physical demand, emotional impact, and performance. However, it has been criticised for being unsuitable for real work environments [6]. Research shows that academics often work beyond the legal number of hours, with males focusing more on work and females on family. Workload affects marital satisfaction through work-family conflict, but does not have a direct impact on family satisfaction [7].
Surveys reveal moderate work and family loads as significant predictors of work-family conflict among academics [8]. Work-family conflict varies by gender, age, marital status, and children, but no direct link with other work-related factors was found [9]. Factors such as depression, anxiety, workload, stress, and burnout are common risks for academics, highlighting the need for preventative studies [10].
Although academics enjoy their work, high workloads and diverse tasks pose challenges [11]. A psychosocial hazard identification scale identified workload and work tempo as key factors for academics [12]. Ergonomic adjustments have been recommended to reduce mental workload [13].
Academics face health risks from their workload, including increased stress and elevated blood glucose levels [14]. During the pandemic, mental workload and work-family conflict contributed to burnout among female instructors [15], and synchronous distance education increased the workload for nursing academics [16].
While various studies have analysed mental workload, the integration of fuzzy logic with the CarMen-Q scale has not been previously implemented. This study presents the first application combining fuzzy logic and CarMen-Q to assess mental workload with the aim of filling this methodological gap and so providing new insights into workload analysis in academia.
3. METHODOLOGY
3.1. Material
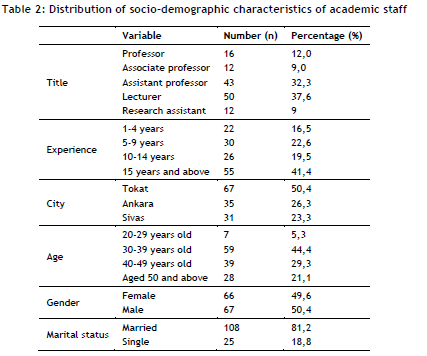
This study proposed an algorithm integrating fuzzy logic, multi-criteria analysis, and the CarMen-Q method to assess mental workload among 133 academic staff from Tokat, Ankara, and Sivas. Using the FAHP, the study identified differences in mental workload between academic titles and socio-demographic factors. The sample included 16 professors, 12 associate professors, 43 assistant professors, 50 lecturers, and 12 research assistants.
Data was gathered via an online survey using the CarMen-Q scale, with a Cronbach's alpha of 0.94 for reliability. Confirmatory factor analysis (CFA) validated the scale, covering temporary, emotional, performance-related, and cognitive workload. The Kolmogorov-Smirnov test assessed normality, and IBM's SPSS 27.0 was used for data analysis. The CarMen-Q scale uses 29 items in four workload dimensions, which are rated using fuzzy linguistic variables. The majority of respondents were lecturers (37.6%), had 15+ years of experience (41.4%), and were from Tokat (50.4%). Most were aged 30-39 (44.4%), were male (50.4%), and were married (81.2%).
3.2. Methodology
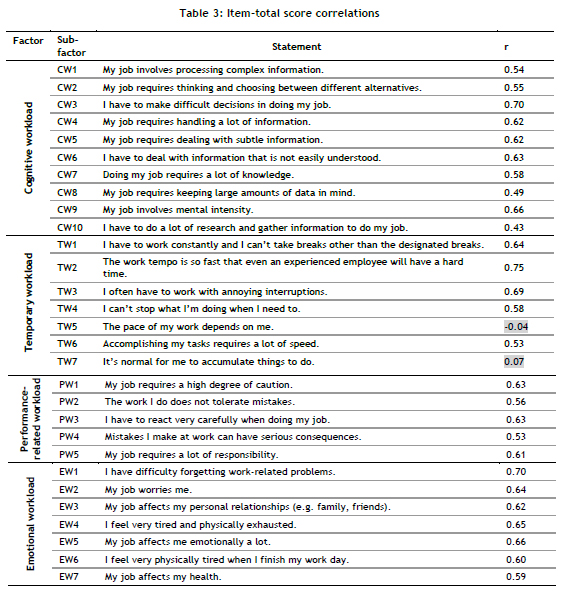
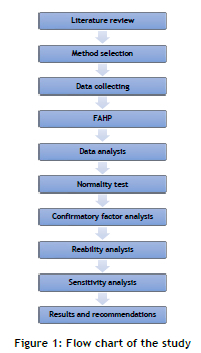
The cognitive workload factor in the CarMen-Q survey consisted of 10 questions related to the extent to which the work required activities such as thinking, perception, calculation, decision-making, and choice owing to factors such as the attention required by the job, processing complex information, preparations necessary for the job, and the level of knowledge required by the job, as well as the simplicity, difficulty, or complexity of the job, and its decision-making aspects. It also included aspects such as acquiring information, difficulties in understanding, complex decision-making, memory load, and the amount of information that needs to be considered. The temporary workload factor comprised seven questions assessing work pace, rhythm, interruptions, breaks, speed demands, job completion pressure, rest status, and time constraints between consecutive activities, focusing on factors such as work pace, rhythm, and individual rest status. The performance-related workload factor included five questions assessing error tolerance, attention, responsibility, job performance requirements, response accuracy, and error severity. It differs from NASA-TLX, which questions performance requirements without considering actual performance levels, focusing instead on subjective evaluations. The emotional workload factor comprised seven questions assessing concerns related to job impact on employee health, personal relationships, job-related difficulties, job-related anxiety, nervousness, stress, and exhaustion, aiming to evaluate concerns and alleviate employee fatigue. Table 3 shows the questions that related to the cognitive workload, temporary workload, performance-related workload, and emotional workload sub-factors in the CarMen-Q scale, developed using the NASA-TLX mental workload measurement method. The flowchart of the study is shown in Figure 1.
3.2.1. Analytic hierarchy process
The AHP method, introduced by Thomas L. Saaty in 1977, is a mathematical method for multi-objective decision-making that considers group or individual priorities and evaluates both qualitative and quantitative variables [17]. The AHP method involves identifying and organising factors related to a decision-maker's objectives into a hierarchical structure. It involves defining goals, identifying influencing factors, and consulting surveys or expert opinions to identify all influencing factors. Potential alternatives are then determined. The hierarchical model is established, and pairwise comparison matrices are created to evaluate alternatives and to determine priority ranking, using Saaty's 1-9 priority scale. The AHP method calculates the consistency ratio (CR) to gauge a decision-maker's ability to make consistent comparisons. If the value is below 0.10, the comparison matrix is considered consistent, while a value above 0.10 indicates inconsistency and may require adjustment. The AHP method calculates the priority value of each alternative by combining factors' and alternatives' priority weights, determining the best option in the decision problem.
3.2.2. Fuzzy logic
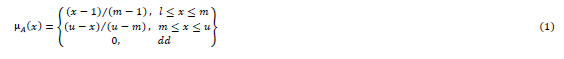
Fuzzy logic, introduced by Zadeh in 1965, is a multi-variable theory used to describe and solve uncertain and imprecise real-world problems. It allows for factors and criteria to be classified without strict boundaries, using intermediate values instead of classical variables such as "yes" or "no". Fuzzy sets are defined by membership functions. The membership function of a fuzzy set A is denoted as μ_Α (x), and a factor's membership in this set is expressed by a number between 0 and 1. If the factor x fully belongs to set Α, μ_Α (x) = 1 ; if it does not belong at all, μ_Α (x) = 0. A higher membership degree indicates a higher degree of membership of factor x in set A. For ease of operations, fuzzy numbers are used in fuzzy sets. In this context, triangular fuzzy numbers are predominantly used. Triangular fuzzy numbers are a special type of fuzzy number. A triangular fuzzy number (A~) is expressed by three real numbers (l<m<u), and the membership function is defined according to these real numbers. The membership function of a triangular fuzzy number is as follows [18]:
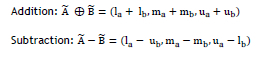
When expressed as a triangular fuzzy number A~(l, m, u), the value m represents the most likely value of the fuzzy number, while l and u represent the lower and upper bounds respectively, indicating the range of fuzziness. When A~= (la, ma, ua) and B~ = (lb, mb, ub) are two triangular fuzzy numbers, the basic fuzzy operations are expressed as follows [17]:
3.2.3. Fuzzy analytic hierarchy process
The algorithm proposed with FAHP in the mental workload measurement problem consists of the following steps:
Step 1: A decision-making team is formed.
Step 2: Factors and sub-factors to be used in the mental workload prioritisation process are taken from the CarMen-Q method, and a hierarchical AHP model is created.
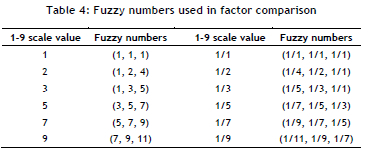
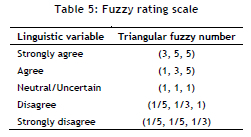
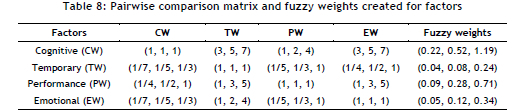
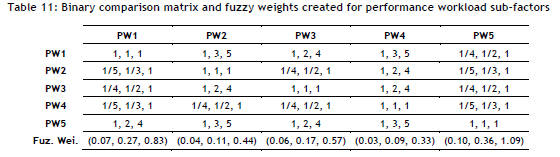
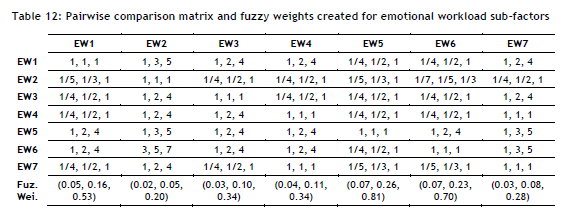
Step 3: Pairwise comparison matrices are arranged to determine the weights of factors and sub-factors, and fuzzy weights of the factors/sub-factors are calculated using the fuzzy geometric mean method. At this stage, comparisons are made using the triangular fuzzy numbers presented in Table 4.
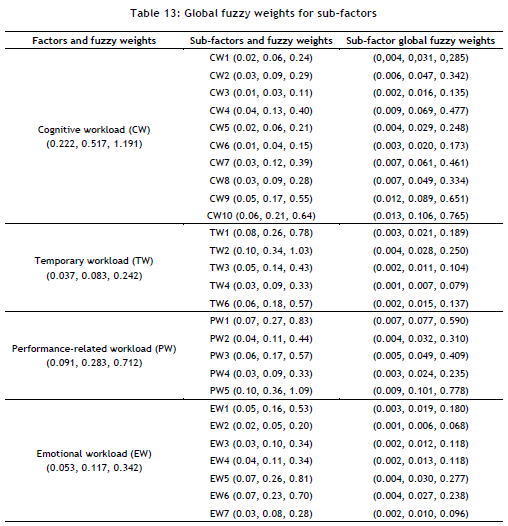
Step 4: Global fuzzy weights for sub-factors are determined by multiplying the fuzzy weight of the sub-factor's factor with the fuzzy weight of the factor itself.
Step 5: The study evaluates candidate personnel using global fuzzy weights, and calculates fuzzy priorities for each candidate based on sub-factors. Linguistic variables and triangular fuzzy numbers are used, and the fuzzy priority value for each candidate is determined by adding the weights of the sub-factors.
Step 6: The fuzzy priorities identified for the candidates are defuzzified. This defuzzification process is performed using the denazification algorithm outlined in the steps below [19]. In this algorithm, the fuzzy number is subjected to different α-cut levels, and the degree to which the defuzzified value represents the fuzzy number is increased through the α-cut operation.
Step 6.1: The fuzzy priority value for the k-th candidate is subjected to the α-cut operation at different α;ι cut levels, where l=1,2,...,L, to determine the lower and upper bound priority values.
Step 6.2: The obtained lower and upper bound priority values are combined using Eqs (2) and (3):
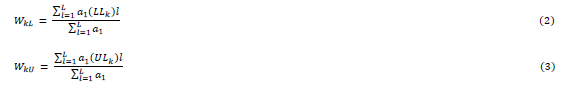
where Wkf. defines the merged lower bound priority value for the k-th candidate and WkH defines the merged upper bound priority value for the k-th candidate.
Step 6.3: The merged lower and upper priority values are combined using expression (4) to determine the defuzzified priority value for the k-th candidate (Wck).
Wck : The defuzzified priority value for the k-th candidate
λ: Optimism index

The optimism index, with λ values of 1, 0.5, and 0, indicates a decision maker's optimistic, moderate, or pessimistic perspectives, with optimistic decision makers preferring higher fuzzy evaluation values.
Step 7: The defuzzified priorities are normalised, and the candidate priorities are determined. The candidate with the highest priority is identified as the academic with the highest mental workload.
4. EXPERIMENTAL RESULTS AND ANALYSIS
4.1. Definition of the decision problem
The implementation involved comparing factors and sub-factors that determined mental workload in pairs using triangular fuzzy numbers. A team of associate professors, assistant professors, and lecturers was formed for the comparisons. The fuzzy geometric mean method was used for analysis. Sub-factors related to mental workload were evaluated using linguistic variables. Total fuzzy priorities for each academic staff member were determined, defuzzified using α-cut and optimism index-based processes, and ranked according to their mental workloads using normalised values.
A survey was created using triangular fuzzy numbers corresponding to the five linguistic variables in the CarMen-Q questionnaire form on Google Forms. Each user was asked to complete the questions related to the socio-demographic characteristics of the academic staff in the first section and the questions provided in Table 3 in the second section via Google Forms. The survey questions were prepared on the basis of the Turkish translation of the CarMen-Q scale by [20]. The academic staff were asked to respond to the questions using the fivelinguistic variables, and content analysis was performed using IBM's SPSS statistical software. The priority values and standard deviations for the CarMen-Q sub-factors are presented in Table 6.
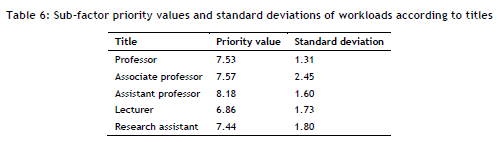
Based on the data obtained from the study, when comparing mental workloads according to academic titles, it was found that the mental workload priority values for assistant professors were higher than those for academic staff with other titles. In addition, significant differences were observed: the average mental workload for professors was 7.53, for associate professors it was 7.57, for assistant professors it was 8.18, for lecturers it was 6.86, and for research assistants it was 7.44. As expected, lecturers, who have less academic anxiety, had the lowest mental workload.
Reliability analysis, specifically item-total correlation analysis, was conducted on the data obtained from the 133 academic staff members. The analysis revealed that the correlation coefficients for the 29 items provided in the scale shown in Table 3 ranged from r = -0.04 to 0.75 (p = 0.000). However, despite two items (TW5 and TW7) yielding statistically significant results, their correlation coefficients were below 0.20. Therefore, it was decided to remove these items from the scale [21].
4.2. Confirmatory factor analysis
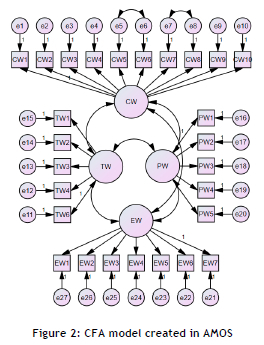
To validate the four factors (temporary workload, emotional workload, performance-related workload, and cognitive workload) and the 29 sub-factors of the CarMen-Q method, CFA was conducted using IBM's SPSS 27.0 and AMOS software [22]. The maximum likelihood method was used in the CFA because of the need to understand the factor structure of the scale and the assumptions of normality [23].
The results of the first-level confirmatory factor analysis for the four-factor scale showed that the theoretical model (the four-factor model) did not meet acceptable and sufficient values (χ2 / df = 2.16 (p <0.05); CFI = 0.82, TL I = 0.80; RMSEA = 0.094). To achieve acceptable fit values for the model, it was decided to remove some items from the scale until the model fit criteria were met [22]. Consequently, items TW5 and TW7 were removed, based on their factor loadings and item-total statistics, and CFA was re-conducted with the remaining 27 items. The fit indices of the final analysis were (χ2 / df = 1.78 (p <0.05); CFI = 0.90, TLI = 0.88; RMSEA = 0.077). The goodness-of-fit values for the first- and second-level four-factor CFA models were found to be close, with the second-level model providing more acceptable values than the first-level model. The second-level four-factor CFA model can be seen in Figure 2.
4.3. Reliability analysis and internal consistency
The CarMen-Q mental workload measurement method underwent reliability analysis using Cronbach's alpha and a Likert-type scale. Internal consistency analyses were performed to determine the consistency of each item on the scale. The Cronbach's alpha values were calculated for factors and for the entire scale, with items with a correlation value below +0.2 removed. Reliability coefficients should exceed 0.70 for tests with over 50 subjects and 20 questions, with a coefficient above 0.90 indicating excellent reliability [23].
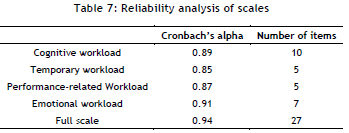
According to the results of the analysis, the internal consistency coefficient for the cognitive workload sub-factor was α = 0.89 (10 items), for the temporary workload sub-factor it was α = 0.85 (5 items), for the performance-related workload sub-factor it was α = 0.91 (5 items), for the emotional workload sub-factor it was α = 0.91 (7 items), and for the overall scale it was α = 0.94 (27 items), as shown in Table 7. Since the Cronbach's alpha coefficient calculated for the entire scale was above 0.70, this indicated the high reliability of the scale [23].
4.4. Research findings
When creating the mental workload prioritisation for academic staff, the steps presented in Section 3 using the AHP method were followed:
Step 1: Determining factors/sub-factors, comparing them using fuzzy numbers, and evaluating candidates based on global sub-factor weights.
Step 2: In the second phase of the study, the factors and sub-factors to be used from the CarMen-Q mental workload measurement method were selected, and it was decided to use the factors and sub-factors presented in Table 4 at this stage.
Step 3: After determining the factors and sub-factors to be used in ranking mental workloads, the weighting phase began. In this phase, factors and sub-factors were compared using triangular fuzzy numbers, as shown in Table 4.
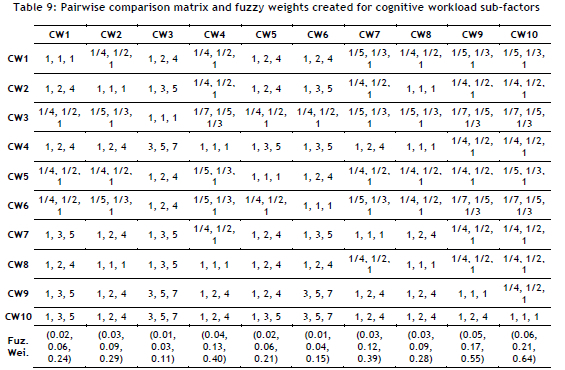
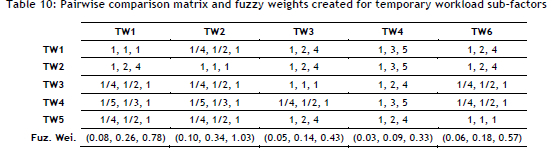
Step 4: In this step, global fuzzy weights for the sub-factors were calculated using the factor and sub-factor fuzzy weights identified in Step 3. The global weights obtained from the fuzzy mathematical operations are presented in Tables 8-11.
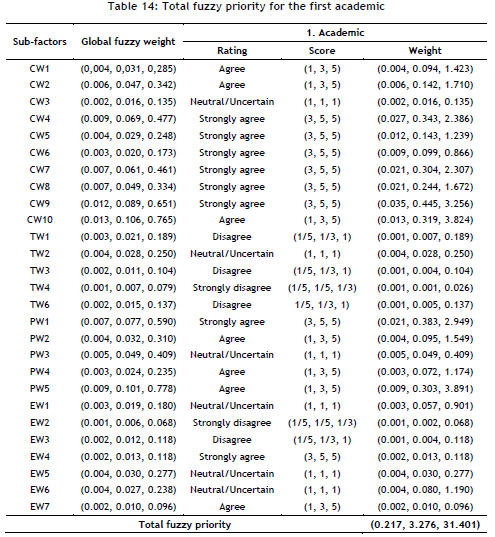
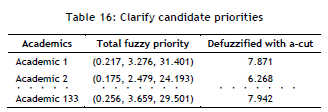
Step 5: After determining the global fuzzy weights, the candidate evaluation phase began. Each candidate was evaluated on the basis of the sub-factors, using the linguistic variables given in Table 6. The calculations for each candidate, along with the total fuzzy priorities, are shown in Table 14.
Fuzzy geometric mean of the first row: {(1x3x1x3)1/4, (1x5x2x5)1/4, (1x7x4x7)1/4}= (1.73, 2.66, 3.74)
Fuzzy geometric mean of the second row: {(1/7x1x1/5x1/4)1/4, (1/5x1x1/3x1/2)1/4, (1/3x1x1x1)1/4}= (0.29, 0.43, 0.76)
Fuzzy geometric mean of the third row : {(1/4x1x1x1)1/4, (1/2x3x1x3)1/4, (1x5x1x5)1/4}= (0.71, 1.46, 2.24)
Fuzzy geometric mean of the fourth row : {(1/7x1x1/5x1)1/4, (1/5x2x1/3x1)1/4, (1/3x4x1x1)1/4}= (0.41, 0.60, 1.07)
Sum of fuzzy geometric means: (3.14, 5.15, 7.81) Fuzzy weight of CW factor: {(1.73/7.81), (2.66/5.15), (3.74/3.14)}=(0.22, 0.52, 1.19)
Fuzzy weight of TW factor: {(0.29/.7.81), (0.43/5.15), (0.76/3.14)}=(0.04, 0.08, 0.24)
Fuzzy weight of PW factor: {(0.71/7.81), (1.46/5.15), (2.24/3.14)}=(0.09, 0.28, 0.71)
Fuzzy weight of EW factor: {(0.41/7.81), (0.60/5.15), (1.07.74/3.14)}=(0.05, 0.12, 0.34)
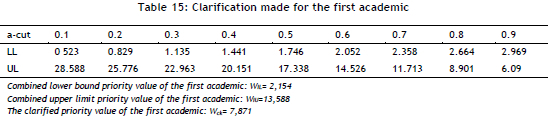
Step 6: In this phase, the defuzzification of the total fuzzy priorities determined for the academics was carried out. Using the equations provided in Section 3, the defuzzification process for the total fuzzy priorities of the first academic respondent was explained with the operations described in Table 15. For the defuzzification stage, α-cut values of 0.1, 0.2, 0.3, 0.4, 0.5, 0.6, 0.7, 0.8, and 0.9 were used sequentially. In addition, a moderate value of 0.5 was used as the optimism index.
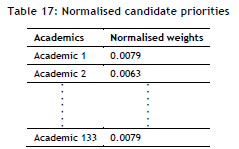
Step 7: The final phase of the proposed mental workload measurement involved normalising the calculated defuzzified priorities and determining their rankings. The results obtained from the normalisation process are presented in Table 17.
When examining the normalised priorities partially presented in Table 17, the total fuzzy priorities of all 133 academics were determined, and the SPSS program was used to perform an ANOVA test to check for significant differences based on title, experience, city, age, gender, and marital status. The results are presented in Table 18.
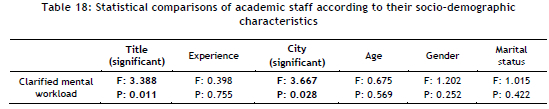
The results of the Tukey and Scheffe post hoc tests revealed that the differences in mental workload among academic staff, based on their titles and the cities where their universities were located, were statistically significant. However, no significant differences were found in classifications based on other demographic characteristics.
4.5. Sensitivity analysis
In Fuzzy AHP, considering that a decision-maker's judgments may vary from person to person or change over time, differences in final decision outcomes may also arise. Sensitivity analysis is a method developed to observe the variability of results in such cases [24]. It provides an alternative way to determine how changes in factors affect the solution. In practice, sensitivity analyses were conducted on a sample group of four individuals selected from 133 academics, based on two different scenarios.
Scenario 1: Sensitivity analysis was conducted by assigning different weights to the cognitive main factor's sub-factors, considering that global fuzzy weight values that are close to each other might change when put to different experts or over time. The highest weight was given to CW3, followed by CW9. The fuzzy priorities of the academics with the new weights were as shown in Table 19.
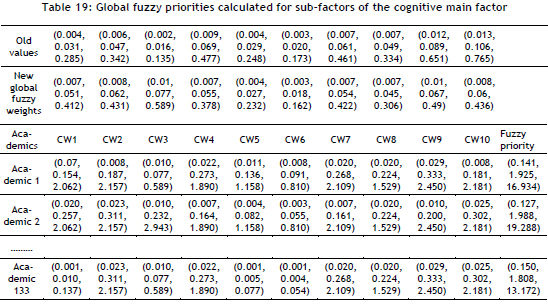
When Table 19 is examined, the highest weight was assigned to CW3 and CW9, with other weights adjusted around these values. Although the first academic had the highest fuzzy priority value under the CW9 sub-factor, the results of Scenario 1 and the calculated fuzzy AHP results shared the same ranking, with the third academic having the highest fuzzy priority among the four academics. This was followed by the second academic, the first academic, and the 133rd academic. According to this sensitivity analysis, although the ranking remained the same, the fuzzy priority of the second academic remained approximately consistent, while the fuzzy priority of the first academic had weakened.
Scenario 2: In this scenario, no changes were made to the global fuzzy weights of the sub-factors. New values were assigned to the global fuzzy weights of the main factors to achieve the fuzzy AHP result. With minimal changes to the weight of the cognitive main factor, high and closely related values were assigned to the weights of the temporary, performance, and emotional workload main factors, resulting in an opposite prioritisation. The results were calculated and are presented in Table 20.
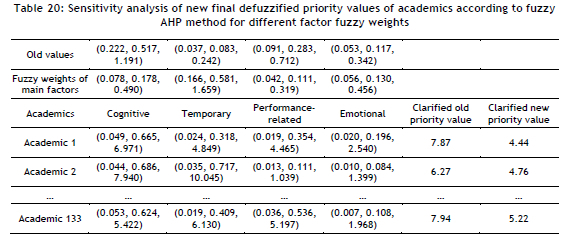
According to Table 20, a comparison of defuzzified priority values from Scenario 2 and the α-cut method showed a change in ranking: the first academic now experienced more mental workload than the second, reversing the initial order. Sensitivity analysis indicated that fuzzy AHP result rankings are mostly consistent. Among the four academics, the third academic consistently showed the highest mental workload. Only in Scenario 2 did the second academic surpass the first in defuzzified priority. Overall, both scenarios confirmed that the third academic bore the highest mental workload.
5. CONCLUSIONS AND FUTURE RESEARCH DIRECTIONS
Occupational health and safety aims to manage not only physical risks but also psychological and mental factors [5]. Mental workload is an important factor in this context because the mental load experienced by academics while working can directly affect their overall health and safety. This study proposes a different solution to the problem of measuring academic staff's mental workload using fuzzy AHP. In the implementation of the proposed model, factors and sub-factors in the decision-making process were compared using fuzzy numbers, allowing for easier evaluation of uncertainties in the process by decision-makers. In addition, linguistic variables were used in the evaluation of the academics based on sub-factors, thereby increasing the degree to which the defuzzified value represented the fuzzy number. As a result, each academic was assigned a priority value, and the one with the highest priority was identified as experiencing the highest mental workload.
When examining the differences in mental workload by academic title, the priority values were found to be as follows: 7.53 for professors, 7.57 for associate professors, 8.18 for assistant professors, 6.86 for lecturers, and 7.4 for research assistants. As shown in Table 19, the difference between titles was found to be significant according to the post hoc test results. In this study, the distinction based on experience as another socio-demographic characteristic was found not to be significant. The average mental workload priority values were 6.81 for academics with 1-4 years of experience, 7.44 for those with 5-9 years, 7.69 for those with 10-14 years, and 7.55 for those with 15 or more years. It should be noted that the experience distributions in the study were approximately similar. Another variable that caused differences in the study was the city distinction. Statistical analyses revealed that the difference was significant. The average mental workload scale values for academics from Tokat were 7.03, from Ankara they were 8.12, and from Sivas they were 7.53. When examining the age distinction variable, the difference was found not to be significant. The average mental workload priority value for academics aged 20-29 was 7.33. For those aged 30-39 the average was 7.18, for those aged 40-49 it was 7.50, and for those aged 50 and above it was 7.89.
In respect of the gender distinction, the tests revealed no significant difference in mental workload. The perceived mental workload priority average for female academics was 7.55, while for males it was 7.31. The study included 66 female and 67 male participants - that is, nearly equal numbers. The higher priority average for women could be attributed to additional responsibilities such as household chores and childcare alongside work responsibilities. The study data and tests showed that the difference in marital status of academics was not significant. The mental workload priority average for married academics was 7.36, while for single academics it was 7.75. The lower average for married academics could be attributed to their greater age and higher level of experience.
University faculty members, in addition to their academic work, also handle many administrative and bureaucratic tasks in their departments. Naturally, these additional activities contribute to an increased workload and decreased academic productivity. In addition, inadequate working conditions (e.g., classrooms, laboratories, teaching materials) and insufficient university financial resources are other factors that negatively affect faculty members' mental workload.
Practical implications
Actions could be carried out to strengthen the existing democratic understanding and diversity in universities. Efforts could be made to reduce bureaucratic difficulties in scientific research project processes. Faculty members could be financially and morally encouraged to benefit from academic exchange programmes, both domestic and international. Faculty members could be supported financially and morally to improve their foreign language proficiency, and encouraged to learn a second foreign language. Training programmes could be provided to enhance faculty members' time management skills and work-life balance. In addition, defining job descriptions for academics, assessing their mental workload, calculating and increasing the number of academics, formalising organisational processes, involving academics in decisions about course schedules, and organising motivational social activities for academics could be beneficial.
Managerial implications
To reduce the mental workload of academic staff, especially those in the early years of their careers, various activities or mentorship systems could be planned to provide social and emotional support from more experienced colleagues and administrators. Providing new faculty members with information about issues they might encounter in academic life, and clearly defining their job descriptions, could help to prevent negative situations such as burnout, role ambiguity, and role conflict. For faculty members with administrative duties, ensuring a balanced distribution of workload and providing opportunities to share responsibilities could allow them to devote adequate time to their primary academic tasks. This could improve the sense of accomplishment for those with administrative roles and increase engagement among other faculty members. In addition, organising events and activities that cater to various interests, creating recreational areas (e.g., sports complexes), and other measures to reduce job-related stress and tension could contribute to a positive work environment. These actions are believed to have a positive impact on job stress reduction and to enhance both individual and family life satisfaction.
The literature review revealed that very few studies compare the mental workload of academic staff by title, and no hybrid studies using the fuzzy AHP method were found. National studies have used the NASA-TLX method for mental workload measurements. In this study, the CarMen-Q method, which had not been previously used to measure mental workload in academics, was used, and a hybrid approach with the fuzzy AHP method was applied.
This study aimed to fill the gap identified in the literature, to provide guidance for future research, and to offer recommendations. It is anticipated that this study should contribute to both the national and the international literature.
The data in this study were obtained from 133 academics working in three cities. Expanding the scope to include academics from different countries, applying the method to a larger sample, and determining the reliability and effectiveness of the method would be useful for generalising the results.
In conclusion, given that mental workload levels among academics vary according to socio-demographic characteristics, it is recommended that decision-makers and administrators consider these characteristics when setting assignments, making appointments, or distributing tasks. For example, when determining teaching loads based on titles, setting additional teaching fees, or calculating academic incentives, socio-demographic factors should be considered.
A future research direction could be to explore the impact of these socio-demographic characteristics on academic performance and job satisfaction. Investigating potential interventions or support systems that could help to mitigate the effects of varying mental workloads among academics could also be a valuable avenue for further study. On the other hand, it would also be beneficial to examine the role of institutional policies and practices in addressing disparities in workload distribution among faculty members. Understanding how these factors interact with socio-demographic characteristics could provide insights into creating more equitable and supportive academic environments.
REFERENCES
[1] Rubio Valdehita, S., López Núñez, M.I., López-Higes Sánchez, R. & Díaz Ramiro, E.M. 2017. Development of the CarMen-Q questionnaire for mental workload assessment. Psicothema, 29(4): 570-576. [ Links ]
[2] Brown, I. D., & Poulton, E. C. (1961). Measuring the spare 'mental capacity'of car drivers by a subsidiary task. Ergonomics, 4(1 ), 35-40. [ Links ]
[3] Bainbridge, L. (1974). Problems in the assessment of mental load. Le Travail Humain, 37(2), 279-302. [ Links ]
[4] Jung, H.S. & Jung, H.S. 2001. Establishment of overall workload assessment technique for various tasks and workplaces. International Journal of Industrial Ergonomics, 28(6): 341-353. [ Links ]
[5] Tosun, S. & Yılmaz, I. 2023. CarMen-Q yöntemi ile uzman ve pratisyen hekimlerin zihinsel iş yüklerinin ölçülmesi ve farklılıkların değerlendirilmesi. Ergonomi, 6(2): 132-144. [ Links ]
[6] Karadag, M. & Cankul, I. 2015. Hekimlerde zihinsel iş yükü değerlendirmesi. The Journal of Academic Social Science Studies, 35: 361-370. [ Links ]
[7] Sener, A. & Coskuner, A.S. 2013. Akademisyenlerin İş ve aile karakteristiklerinin evlilik aile ve yaşam tatmini ile ilişkisi iş ve aile çatışmasının aracı rolü. Sosyolojik Araştırmalar e-dergisi, 1(1): 1-11. [ Links ]
[8] Kahraman, U. & Çelik, K. 2018. Akademisyenlerin iş yükü algıları ile iş ve aile çatışmaları arasındaki iliski. Yükseköğretim ve Bilim Dergisi, 8(1): 95-105. [ Links ]
[9] Tekingündüz, S., Kurtuldu, A. & Öksüz, S. 2015. İş-aile yaşam çatışması, iş tatmini ve iş stresi arasındaki ilişkiler. Siyaset, Ekonomi ve Yönetim Araştırmaları Dergisi, 3(4): 27-42. [ Links ]
[10] Sahin, R., Özkan, S. & İlhan, M.N. 2019. Akademisyenlerde iş sağlığı ve iş sağlığını etkileyen faktörler. Gazi Sağlık Bilimleri Dergisi, 4(1): 11-18. [ Links ]
[11] Aslan, Z. & Cengiz, E. 2015. Akademisyenlerin iş stresi ile iş motivasyonu ilişkisi. Gümüshane University Electronic Journal of the Institute of Social Science, 6(12): 25-43. [ Links ]
[12] Baykan, P. & Ünal, E.S. 2022. Akademisyenlerin çalışma ortamında karşılaştıkları psikososyal tehlikeler: Bir ölçek geliştirme çalışması. İşletme Araştırmaları Dergisi, 14(1): 169-181. [ Links ]
[13] Eraslan, E., Can, G.F. & Atalay, K.D. 2016. Mental workload assessment using a fuzzy multi-criteria method. Tehnicki vjesnik/Technical Gazette, 23(3): 667-674. [ Links ]
[14] Kusnanto, K., Rohmah, F.A., Andri, S.W. & Hidayat, A. 2020. Mental workload and stress with blood glucose level: A correlational study among lecturers who are structural officers at the university. Systematic Reviews in Pharmacy, 11(7): 253-257. [ Links ]
[15] Fitriasari, A., Septianingrum, Y., Purwanti, N., Ainiyah, N., Wardani, E.M. & Bistara, D.N. 2022. Analysis of mental workload and work family conflict with burnout on lecturers who work from home during pandemic. Bali Medical Journal, 11(2): 761-765. [ Links ]
[16] Yılmaz, K., Aktaş, D. & Yazıcı, G. 2024. Nursing education and mental workload of academics during coronavirus pandemic. Genel Sağlık Bilimleri Dergisi, 6(1): 19-31. [ Links ]
[17] Saaty, T.L. 1980. The analytic hierarchy process. The Journal of the Operational Research Society, 41(11): 1073-1076. [ Links ]
[18] Zimmerman, B.J. 1990. Self-regulated learning and academic achievement: An overview. Educational Psychologist, 25(1): 3-17. [ Links ]
[19] Dagdeviren, M., Eraslan, E. & Mustafa, K. 2005. Çalişanlarin toplam iş yükü seviyelerinin belirlenmesine yönelik bir model ve uygulamasi. Gazi Üniversitesi Mühendislik Mimarlık Fakültesi Dergisi, 20(4): 517-525. [ Links ]
[20] Akca, M., Yavuz, M. & Küçükoğlu, M.T. 2020. Zihinsel iş yükünün ölçümü: CarMen-Q ölçeğinin Türkçe'ye uyarlaması. Yaşar Üniversitesi E-Dergisi, 15(60): 675-691. [ Links ]
[21] Secer, İ. 2015. Üniversite öğrencilerinde okul tükenmişliği ile psikolojik uyumsuzluk arasındaki ilişkinin incelenmesi. Atatürk Üniversitesi Sosyal Bilimler Enstitüsü Dergisi, 19(1): 81-99. [ Links ]
[22] Harrington, D. 2009. Confirmatory factor analysis. Oxford University Press. [ Links ]
[23] Kline, P. 2014. An easy guide to factor analysis. Routledge. [ Links ]
[24] Ozdagoglu, A. 2008. Bulanık AHP yaklaşımında duyarlılık analizleri: Yeni bir hammadde tedarikçisinin çözüme eklenmesi. İstanbul Ticaret Üniversitesi Fen Bilimleri Dergisi, 7(13): 51-72. [ Links ]
Submitted by authors 20 May 2025
Accepted for publication 22 Oct 2025
Available online 12 Dec 2025
* Corresponding author samet.tosun@gop.edu.tr
ORCID® identifiers
T. Samet
https://orcid.org/0000-0002-5454-3057
Y. Ibrahim
https://orcid.org/0000-0002-5959-7353
