


Services on Demand
Journal

Article
 English (pdf)
 Article in xml format
 Article references
 Send this article by e-mail
Indicators
Related links
-
 Cited by Google
 -
 Similars in Google
Share

 Permalink
South African Journal of Industrial Engineering
On-line version ISSN 2224-7890
S. Afr. J. Ind. Eng. vol.27 n.3 Pretoria Nov. 2016
https://doi.org/10.7166/27-3-1626
GENERAL ARTICLES
The need for a comprehensive energy management information system for industries#
P. Goosen*; J.A. Swanepoel; J.N. du Plessis
Center for Research and Continued Engineering Development (CRCED) North-West University, Pretoria, South Africa
ABSTRACT
Electricity costs in South Africa are increasing rapidly, and the funding hurdle rates for energy conservation incentives are decreasing. Therefore, with rising international competition and increasing operational costs, marginal industries need to focus on energy management strategies where larger savings can be achieved with lower capital expenditure. This paper sketches the need for a comprehensive energy management information system (EMIS). Common industrial energy management pitfalls are identified and energy conservation incentives are outlined. New focus points that improve client awareness and in turn improve the sustainability of energy management interventions are also highlighted. However, benefitting from energy incentives is becoming more complex. Therefore, many clients do not benefit from these incentives unless specialised Energy Service Companies (ESCos) are employed. ESCos, however, require large amounts of data to manage clients' energy effectively. Herein lies the need for a comprehensive EMIS that aids ESCos and their clients with the energy management process. An EMIS was developed and implemented for several industries in South Africa. Data is automatically collected, processed, analysed, and presented on a daily basis. A case study investigates the exorbitant amounts of data and reports that are managed automatically, which further highlights the need for a comprehensive EMIS.
OPSOMMING
Die koste van elektrisiteit in Suid-Afrika neem vinnig toe en die befondsing struikelblok vir energiebesparing innovasie is besig om weg te kwyn. Met die toenemende internasionale mededinging en bedryfskostes moet marginale industrieë fokus op energiebestuur-strategieë wat groter besparings kan bewerkstellig met laer kapitaalbesteding. Hierdie artikel skets die behoefte vir 'n omvattende energiebestuur inligtingstelsel. Algemene industriële energiebestuur slaggate word geïdentifiseer en energiebesparings-insentiewe word uiteengesit. Nuwe fokuspunte wat kliënt-bewustheid verbeter en dus die volhoubaarheid van energiebestuur verbeter word uitgelig. Om voordeel te trek uit energiebesparings-insentiewe word meer kompleks en baie kliënte trek nie voordeel daaruit tensy daar van energiediensmaatskappye gebruik gemaak word nie. Energiediensmaatskappye benodig egter groot hoeveelhede data om hul kliënte se energie doeltreffend te bestuur. Die behoefte lê dus in 'n alomvattende energiebestuur inligtingstelsel wat energiediensmaatskappye en hul kliënte kan bystaan. So 'n inligtingstelsel is ontwikkel en geïmplementeer by verskeie industrieë in Suid-Afrika. Data word outonoom bymekaargemaak, geprosesseer, geanaliseer en voorgehou op 'n daaglikse basis. 'n Gevallestudie ondersoek die buitensporige data volumes en verslae wat outonoom genereer word. Dit beklemtoon die behoefte vir n alomvattende energiebestuur inligtingstelsel.
1 INTRODUCTION
South African electricity tariffs and international non-renewable energy costs are increasing at a rapid rate [1]. These trends highlight the need for competitive, energy-intensive industries to reduce energy cost [2]. An international drive for improved energy efficiency is incentivising and regulating industrial, commercial, and residential areas to reduce their energy consumption. The improvement of energy efficiency in all these sectors, however, remains a slow and expensive process [2]. Improving energy efficiency requires the updating, replacement, or addition of new, more effective devices, infrastructure, or control systems. However, these interventions are expensive, with both lengthy payback periods and extended periods of time needed to install or implement them [3].
In energy-strapped environments, like South Africa, incentive and rebate programmes provide crucial financial and legislatorial assistance to the industrial, commercial, and residential sectors [4]. This provides the required support to the demand side of the South African electricity network to reduce demand and improve energy efficiency [5]. However, with an aging generation infrastructure, the South African electricity utility, Eskom, and the National Energy Regulator of South Africa, NERSA, are shifting focus away from these programmes, in order to increase profits and finance new infrastructure. The impact of this shift is apparent in the decreasing incentive hurdle rates and changes in legislation, which make it increasingly difficult for the demand side to reduce energy consumption.
Although the demand side needs to reduce energy consumption, interventions and energy efficiency improvements need to be self-funded, which remains difficult in marginal and highly competitive environments. Effective management and an altered focus in industry can provide a stepping stone to reduce energy cost, and so doing, provide the needed financial flexibility to implement additional, more costly energy efficiency improvements (as seen in Figure 1) [6].
Industry is aware of opportunities for more energy-efficient operation, but the high infrastructure cost and the risk of operational down-time weighs against the potential benefits. The installation of more energy efficient equipment is expensive and requires extended down-time. Hurdle rates of energy efficiency incentives are also decreasing and becoming more complex. Improved energy management reduces this cost and risk, but also requires experience to ensure a successful outcome. Addressing these common pitfalls in energy management assists clients to manage operations and alter procedures to decrease energy costs. An Energy Service Company (ESCo) typically holds this expertise and actively employs tools to assist with data processing and reporting, in order to achieve efficient energy management.
Based on the above arguments, the following sections of this paper will:
• address common pitfalls that inhibit consumers from achieving maximum energy cost-saving potential;
• summarise the regulations, legislations, and incentives available to clients in order to improve their energy efficiency;
• propose a more structured energy management strategy;
• describe a comprehensive energy management information system (EMIS) employed by an ESCo to assist them with the energy management of large energy consumers; and
• analyse results of an EMIS data investigation to accentuate its need further.
2 COMMON PITFALLS
A few common pitfalls are found in industrial or commercial energy management. These pitfalls often prevent the demand side from achieving all possible savings from existing circumstances, including: time-of-use (TOU) pricing, new incentives, new legislation, and new programmes.
2.1 Isolated focus or lack of focus
Personnel or individuals often focus either on specific tasks at hand or on too many tasks at once. Key performance indicators from different sectors generally align personnel outcomes and personnel drive with specific areas of focus. These areas of focus include production targets, production rate targets, component reliability, component availability, or in some cases, energy efficiency. Aligning the personnel drive with specific focus areas works well to motivate these individuals to achieve optimised solutions; however, the areas are sometimes misaligned with larger ideals, which results in the overall targets not being met. Additionally, if personnel focus is unclear, or if there are too many focus areas for individuals with a lot of different responsibilities, some areas, especially energy management, are often inadequately executed or overlooked entirely.
2.2 Poor integrated management
As discussed in Section 2.1, personnel are structured into specific areas of focus, such as maintenance, production, operations, and support. However, energy management, as a multi-disciplinary field, requires the collaboration of multiple departments. Most often, the different departments are isolated and collaborate only in a crisis or under forced circumstances. This phenomenon usually goes unnoticed and reduces the amount of energy savings that is achieved.
2.3 Lack of communication and outdated systems
Older systems and infrastructure limit the amount of information that can be used to analyse present energy performance. Energy management is therefore restricted in these circumstances, as feedback or reporting does not indicate where possible improvements can be made. Integrated reporting and communication is thus essential in order to set out and quantify possible energy consumption and energy cost improvements. Referring back to Section 2.1, some personnel will also increase energy consumption in order to achieve other key performance indications. However, the increase in energy consumption or cost is not reported on and often remains unnoticed and unimproved.
2.4 Outdated procedures
Energy management is a fluctuating and dynamic environment. New infrastructure, procedures, and best practices are updated and improved frequently. New incentives and programmes are also developed on a constant basis. However, most personnel remain focused on other fields or remain isolated in their specific work environment without learning or taking note of newer, more effective procedures. More experienced personnel also tend to remain reluctant to alter present procedures because these procedures are tried and tested. However, noting and applying new standards, procedures, and best practices as they develop remains crucial in the energy sector.
3 REGULATION, LEGISLATION, AND INCENTIVES
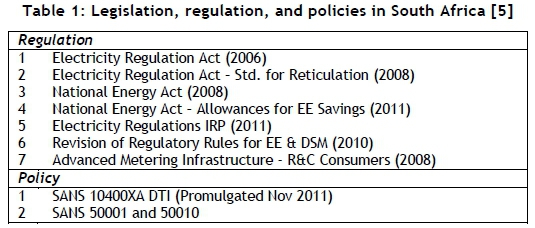
Legislation and regulation provides a framework in which energy management can take place. This regulatory structure also provides the guidelines for the development of policies and standards that are used in the energy sector. Different funding and rebate incentives are also available to promote the compliance and regulation of the energy sector. Regulation, legislation, and policies pertaining to South African and international energy management are summarised in Table 1.
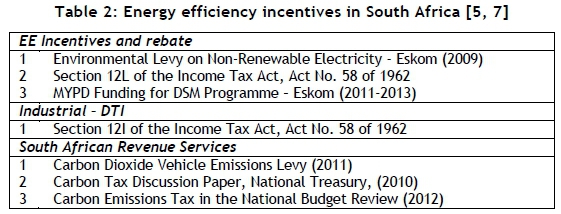
Energy consumers in South Africa are motivated by both government and NERSA to improve energy efficiency and reduce energy cost with multiple different incentives. These incentives include infrastructure funding, tax rebate incentives, environmental levies, and carbon taxation. The different incentives and rebates are summarised in Table 2. However, applying for and implementing these different incentives remains a complex task, and the incentives fluctuate in availability and hurdle rate on a frequent basis. This fluctuation also makes it increasingly difficult for clients and some ESCos to implement and benefit from these incentives.
Eskom has been experiencing a notable electricity production shortfall since 2008. In addition, an uneven demand profile showcases increased demand pressure during morning and evening peaks. As a result, different TOU tariff structures are used to reduce peak demand in the South African electricity market [1]. The aim of these TOU tariff structures is to provide incentives for the demand side to shift consumption to less-constrained times of the working week. As a result of the demand side's response to this TOU tariff implementation, the South African electricity demand has changed and relieved some of the pressure from the electricity supply.
However, the demand increased to such an extent in 2015 that the altered demand profile once again placed strain on supply in peak periods. Integrated demand management projects previously assisted clients in achieving larger benefits from the correct use of these TOU structures; however, with decreasing hurdle rates and increasing market pressure, these projects are becoming more difficult to implement [6]. Large potential for improvement still remains in the South African demand profile. A lot of opportunities for TOU cost savings are unused by the demand side. The onus of achieving this benefit, however, is shifting away from specific Eskom-funded projects to client-managed and client-initiated load profile improvement.
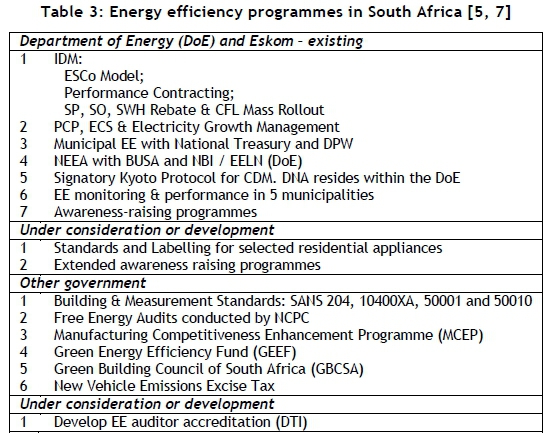
Different support and demand-side management (DSM) programmes have been developed and made available for both clients and ESCos. These programmes have been implemented by different institutions including Eskom, the South African Department of Energy, and other facets of government. A summary of present incentive programmes and energy efficiency support and development programmes is given in Table 3.
Legislation, regulation, and incentives are often complex and are also updated on a frequent basis. In many cases, specialised personnel are required to assist the demand side to navigate the complex routes and corridors that energy legislation and regulation entail. Benefitting from incentives is also becoming more complex. The National Cleaner Production Centre (NCPC) of South Africa conducts free energy audits and, through its Industrial Energy Efficiency (IEE) project, makes recommendations regarding resource efficiency and cost-saving opportunities [4, 7]. However, sustaining project savings and improvements is difficult without proper maintenance [8]. As a result, many consumers do not use or benefit from these incentives unless specialised ESCos are employed.
4 STRUCTURED ENERGY MANAGEMENT
One of the key elements of sustainable projects remains personnel focus. Personnel focus can be maintained by quantifying key deliverables or key performance indicators. Revising these key performance indicators will improve both the awareness and sustainability of energy management interventions. It will also motivate personnel to creatively apply personal experience to energy management and improve possible savings.
For example, the cement industry monitors several different key performance indicators to ensure optimal operation. The performance indicator aimed at improving energy efficiency is the amount of energy consumed per ton of product produced (kWh/t on electricity equipment and MJ/t on other energy-intensive equipment). These performance indicators motivate personnel to operate the cement production equipment at optimal efficiency; however, they do not indicate how well the operational personnel use TOU tariff structures. Adding a key performance indicator that describes the cost intensity per ton produced ((energy cost)/t) will therefore motivate personnel to align operational idle time with more expensive TOU tariff periods.
A second step is to create a platform for communication between different departments of the business. For example, in the cement industry, combining the expertise of the production, maintenance, and operational personnel on a frequent basis to address the interdisciplinary issue of energy management will improve possible savings. Dedicated energy management personnel are employed by many different industries. However, these personnel generally only form a consulting wing of the company. The executive powers of the site at hand and the personnel at the considered site still execute all operational tasks, during which the energy management personnel consult, sometimes in a very ineffective manner. The premise for energy cost improvement thus lies on frequent communication between the different departments and direct executive consulting by energy management personnel. Doing this ensures that all personnel and operational tasks maintain the focus on energy cost and energy efficiency.
The number of dedicated energy management personnel, however, is limited. Large numbers of possible projects and constantly changing legislation and incentive platforms limit the impact that these dedicated personnel members have on industry-wide energy efficiency and energy cost improvement. In industry, there remains a need for active, effective, and focused consulting by ESCos. To manage the energy use of clients effectively, however, an ESCo must have the necessary tools in place that will aid with the organisation and analysis of energy-related data.
The ISO 50001 standard for energy management is based on a continual improvement model to help organisations manage their energy efficiency by means of an energy management system [9, 10]. However, the continuous nature of the standard requires increasingly more measurements and analysis of data. Consequently, this data should be managed by an automated and integrated system that provides personnel with the most essential energy information.
5 COMPREHENSIVE ENERGY MANAGEMENT INFORMATION SYSTEM
The need was established for an energy management information system (EMIS) that contains the correct information and allows for interpretation of this information in a way that assists industry to benefit from or comply with energy management standards, incentives, legislation, and regulation.
5.1 Data collection process
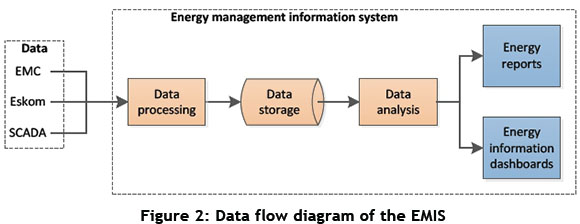
Data required for effective energy management is received in various formats from various sources. The range of data formats includes energy invoices, 30-minute interval data from External Metering Companies (EMCs), and two-minute interval data from the client's Supervisory Control and Data Acquisition (SCADA) system. Figure 2 shows a flow diagram of the EMIS. All data is processed into a generic format, and processed data is stored in a database. Data is retrieved from the database to be analysed and to generate useful energy information. Reports are compiled with the energy information, which can also be viewed on online dashboards.
5.2 Bills (risks and opportunities)
A starting point for such a system is to import information from electricity bills. This information allows for monthly budgeting and the identification of areas for optimisation. Opportunities that can by identified include notified maximum demand adjustments and time-of-use optimisation. These verified electricity consumption figures can also be used to assess the future risk of carbon taxation, electricity cost inflation, and excessive reactive power readings. There are a number of dashboards that show energy information; some of these dashboards are explained in more detail in Table 4.
5.3 System detail
To improve the resolution of monthly monitoring, electricity consumption data can be obtained on a daily basis from Programmable Logic Controllers (PLC), SCADA systems, historian systems, and metering databases. At this resolution, automated data collection is required to ensure data continuity. This data could typically consist of half-hourly data that forms daily profiles that can be compared with target profiles, in order to provide a daily target for energy management personnel. After obtaining access to electricity data from diverse data sources, it was realised that data for other energy types such as coal, gas, and diesel are also available on similar sources.
There are two main dashboards for system details: monthly system detail and daily system detail. The monthly dashboard shows a yearly overview of each system's monthly energy performance. The daily dashboard shows a weekly overview of each system's daily energy performance. More detail for each view is available, showing average energy consumption profiles for the selected month or day.
5.4 Projects
In extension to this system-related data, the performance of specific energy projects or DSM initiatives can also be measured by comparing the actual performance to the baseline constructed before the intervention. Performance calculations can be tailored according to the specific DSM strategy, such as a load-shifting, energy efficiency, or peak-clipping strategy. This performance assessment calculation can be compared with the findings of the measurement and verification (M&V) team appointed to assess the performance of the project.
Similar to the systems detail mentioned in Section 5.3, there are two main dashboards for projects: monthly project detail and daily project detail. The monthly dashboard shows a yearly overview of each project's monthly energy performance. The daily dashboard shows a weekly overview of each project's daily energy performance. More detail for each view is available, showing average energy consumption profiles for the selected month or day.
On a daily basis, issues related to a project's performance - for example, data loss - is automatically marked and the relevant ESCo project engineer is notified by email. The engineer can then investigate the issue further and resolve the issue, if possible. The engineering manager is also notified of any unresolved issues.
5.5 Environmental
With access to data on energy consumption that includes electricity, coal, gas, and diesel, a single energy management information platform can also assist with annual environmental reporting. Additional information not automatically obtained can be inserted by environmental personnel in order to produce a complete environmental report without excessive data processing.
5.6 Custom views
The luxury of access to an extensive set of data prompts user specific reporting or analysis. A specific view that allows users to create customised energy information dashboards provides a comprehensive solution. The underlying framework for the customised views are generic, but users can specify which charts, tables, and other information they want to analyse. Multiple users can access a specific view, or a view can be limited to a specific user.
5.7 Document management
The EMIS also aids the ESCo and clients to manage documentation related to their energy use effectively. Adhering to the ISO 50001 standard requires much documentation about energy policies, energy reviews, energy baselines, energy performance indicators, and action plans. Benefitting from incentive programmes like tax rebates (Section 12L of the Income Tax Act) also requires stringent traceability of M&V documentation. A generic document control manager is therefore a helpful tool.
To aid with navigating through the documents, they are linked to specific systems in the operational structure of a client group, as well as a predefined document structure. Documents can further be filtered by years and labels linked to each document. Finally, a user can also search for specific key words to find documents. This functionality displays documents with these key words in the document name, ordered by relevance.
6 RESULTS OF AN EMIS DATA INVESTIGATION
The EMIS is implemented for a number of industrial client groups in South Africa. These implementations include several mining groups, cement groups, and a steel manufacturer. Data is collected from various sources automatically on a daily basis. Each point of measurement or data object is referred to as a 'tag'. For example, the energy consumption of a compressor is measured and stored in a tag. A tag has a specific resolution at which data is stored. High-resolution tags are processed into 48-samples per day. Other tags have much lower resolutions - for example, daily production totals and monthly electricity bill charges.
Figure 3 shows the number of tags extracted from energy bills for five client groups, as well as the number of data points that these tags can have over a year. These tags have a monthly resolution, since clients are invoiced on a monthly basis. Each point of delivery has several tags and each site can have multiple points of delivery. Figure 3 shows that the electricity bills for a client group with a large number of sites, like Mine Group A, can produce more than 2,30θ tags and more than 28,000 data points per year.
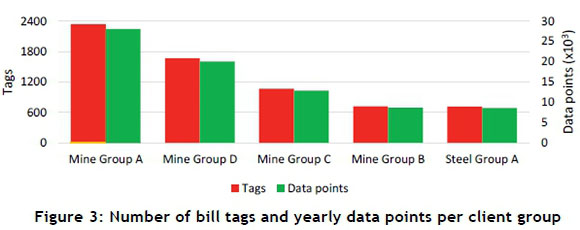
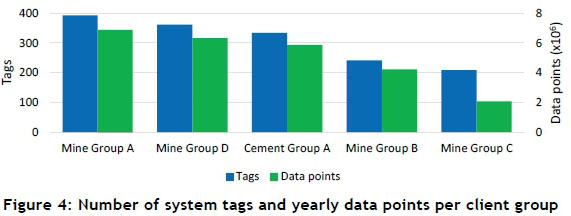
Figure 4 shows the number of 48-sample system tags used for five client groups. In some cases, these tags can have relatively low-level detail; for example, the electricity consumption of an individual pump. Depending on the detail level, a client group can easily have more than 200 high-resolution data tags. Collecting this amount of data on a daily basis without a comprehensive system will be a daunting task. Figure 4 also shows the total number of data points that the tags will have if extrapolated over a year.
Having all these data points is pointless if they are not analysed further and presented as valuable information. On a daily basis, the EMIS automatically sends out more than 40 energy performance reports to more than 90 recipients; that is over 14,600 reports per year. ESCo and client personnel are also able to access this data through the web application.
At the moment, the level of system detail is limited to the energy consumption of individual equipment units - for example, a pump or compressor unit. If, however, the ESCo wants to do condition monitoring on each unit, then more measurements are required. For example, basic condition monitoring on a large mine de-watering pump requires about ten measurements; these pump measurements include power, flow, suction pressure, discharge pressure, vibration, temperature, etc.
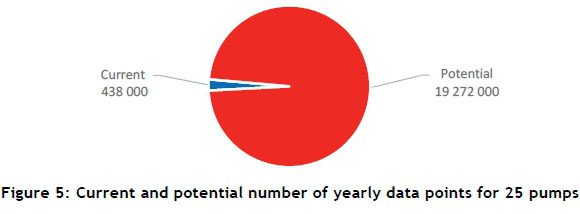
However, for more advanced condition monitoring on well-equipped pumps, more than 45 individual measurements are available. This will have a tremendous effect on the number of data points that should be analysed, considering that a single mineshaft can have more than 25 de-watering pumps. Even if this data is aggregated to 48-samples per day, these 25 pumps will add almost 19 million additional data points per year. Figure 5 illustrates the relation between the current setup (one measurement per pump) for the 25 pumps and the potential setup if all 45 pump tags are used.
The above-mentioned scenario only shows the tip of the iceberg for a mineshaft. The mineshaft has 25 large de-watering pumps, but there is a lot of other equipment that can also benefit from condition monitoring. Examples of such equipment include fridge plants, winders, bulk air coolers, compressors, etc. However, a mining group like Mine Group A has more than 15 mineshafts, as well as a number of processing plants. Therefore, it will be impossible to manage this large amount of data without a comprehensive EMIS.
7 CONCLUSION
Complex incentive programmes and reducing rebate hurdle rates are extending the gap between present operation and the installation of more energy-efficient equipment. However, the large potential for energy cost savings, via improved operational and energy management, presents the opportunity to bridge the same gap. Common pitfalls in energy management strategies, however, limit the application of improved operations and energy management. It also limits the ability of energy managers to use available incentives to reach energy management goals. Small shifts in key performance indicators and improved communication will both improve awareness and reverse the impact of these pitfalls. Reducing energy costs also allows the demand side to implement self-funded energy improvement measures.
A comprehensive EMIS is vital to support any energy management effort. The amount and resolution of data from diverse data sources poses the risk of overwhelming energy management personnel to a point where efficient energy management is not possible. A single platform is required to retrieve, analyse, store, and represent data in a way that assists energy managers to identify potential areas for optimisation, and assist personnel to reap the maximum benefits of adherence to regulation, legislation and incentives.
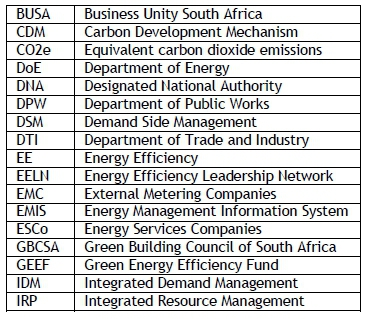
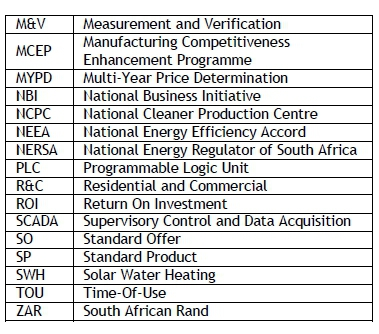
ACRONYMS AND ABBREVIATIONS
REFERENCES
[1] Abdelaziz, E.A., Saidur, R. and Mekhilef, S. 2011. A review on energy saving strategies in industrial sector. Renewwable and Sustainable Energy Reviews, 15(1), pp. 150-168. [ Links ]
[2] Dong, C., Huang, G.H., Cai, Y.P. and Liu, Y. 2013. Robust planning of energy management systems with environmental and constraint-conservative considerations under multiple uncertainties. Energy Conversion and Management, 65, pp. 471 -486. [ Links ]
[3] Swanepoel, J.A., Mathews, E.H., Vosloo, J.C. and Liebenberg, L. 2014. Integrated energy optimisation for the cement industry: A case study perspective. Energy Conversion and Management, 78, pp. 765-775. [ Links ]
[4] Budge, M., Booysen, W. and Vosloo, J.C. 2015. Simplifying the process of identifying viable industrial energy efficiency incentives. 2015 International Conference on the Industrial and Commercial Use of Energy (ICUE). [ Links ]
[5] Department of Energy and SANEDI. 2012. South African energy efficiency high level policy map. October. [ Links ]
[6] Trollip, H., Butler, A., Burton, J., Caetano, T. and Godinho, C. 2014. Energy security in South Africa. Mitigation Action Plans & Scenarios, No. 17. [ Links ]
[7] Bolt, G.D., Vosloo, J.C. and Pelzer, R. 2014. Strategies for energy efficiency funding in the absence of industrial Eskom-IDM support. 2014 International Conference on the Industrial and Commercial Use of Energy (ICUE), Cape Town [ Links ]
[8] Groenwald, H.J., van Rensburg, J.F. and Marais, J.H. 2014. Business case for industrial DSM maintenance. 2014 International Conference on the Industrial and Commercial Use of Energy (ICUE), Cape Town. [ Links ]
[9] Fiedler, T. and Mircea, P.M. 2012. Energy management systems according to the ISO 50001 standard - Challenges and benefits. 2012 International Conference on Applied and Theoretical Electricity (ICATE), Craiova. [ Links ]
[10] van Heerden, M., Kleingeld, M. and Vosloo, J.C. 2015. Improving DSM project implementation and sustainability through ISO standards. 2015 International Conference on the Industrial and Commercial Use of Energy (ICUE), Cape Town. [ Links ]
Available online 11 Nov 2016
Presented at the 27 annual conference of the Southern African Institute for Industrial Engineering (SAIIE), held from 27-29 October 2016 at Stonehenge in Africa, North West, South Africa
* pgoosen@researchtoolbox.com
# This work was sponsored by HVAC International.
