


Services on Demand
Journal

Article
 English (pdf)
 Article in xml format
 Article references
 Send this article by e-mail
Indicators
Related links
-
 Cited by Google
 -
 Similars in Google
Share

 Permalink
Journal of Contemporary Management
On-line version ISSN 1815-7440
JCMAN vol.17 n.1 Meyerton 2020
https://doi.org/10.35683/jcm19103.58
RESEARCH ARTICLES
Managing inflation risk in emerging markets using infrastructure investments - a fact or a myth? A non-linear perspective
R MagwevaI, *; M SibandaII
IUniversity of KwaZulu-Natal, School of Accounting, Economics and Finance rmagweva@gzu.ac.zw ORCID nr: 0000-0002-8573-784x
IIUniversity of KwaZulu-Natal, School of Accounting, Economics and Finance sibandam@ukzn.ac.za
ABSTRACT
Inflation is one of the key economic risks affecting savers, investors and the corporate world in general. Investors are thus continuously on the hunt for investments and assets which can protect their wealth from this risk. This study evaluated the ability of infrastructure investments to hedge inflation in emerging markets. The study adopted non-linear autoregressive distributed lag model (NARDL) to enable detection of the asymmetric inflation hedging ability of infrastructure in the long and short run. The results indicated that infrastructure investments in emerging markets are not asymmetric inflation hedgers, implying that investors cannot hedge positive and negative inflation shocks using infrastructure investments in these markets. Considering the stochastic and distributional properties of listed and unlisted infrastructure investments, it was noted that they can play a complementary role in a portfolio. This implies that investors can realise some risk diversification benefits by including listed and unlisted infrastructure in the same portfolio. The present study makes noteworthy positive contributions in terms of methodology (non-linear models), asset class under consideration (infrastructure) and geographical coverage (emerging markets). Past studies used linear models, concentrated on general equity and gold's ability to hedge inflation in developed nations.
Key phrases: Emerging markets; hedge; inflation; infrastructure; investors and non-linear
1. INTRODUCTION
Worldwide, preservation of purchasing power is one of the key objectives pursued by individual and institutional investors (First State Investments 2018). As noted by Briere and Signori (2011), inflation risk is one of the worst and most devastating macro-economic enemies of investors, savers and pensioners. Identifying an asset which hedges inflation risk is thus paramount, and investors opt for diversified portfolios and hire active asset managers in an attempt to protect their wealth from inflation, among other risks (Austin & Dutt 2016:936-939; Brenchley 2019; Naser 2017:470-475). An inflation hedge is an asset whose nominal returns are positively and significantly related to inflation either in the short and / or long run (Naser 2017:470-475).
While numerous studies have evaluated different commodities and asset classes' ability to hedge inflation, the results are inconclusive (Phiri 2016). The findings reported by previous researchers are in tandem with the two main theories on the relationship between asset returns and inflation. The first is the Fama and Schwert (1977:115-146) model which stipulates that stock returns do hedge inflation, implying a positive relationship. The second theory is the 'proxy' hypothesis by Fama (1981:545-564) which indicates the existence of a negative relationship between stock returns and inflation. Asset returns and inflation often exhibit a positive and negative relationship even in the same nation over different time horizons (Davari & Kamalian 2018:295-300; Phiri 2016). In support of this argument, Ang, Brière and Signori (2012:36-55) and Davari and Kamalian (2018:295-300) noted that the relationship between stock returns and inflation is negative in the short run and positive in the long run. This being the case, the existence of an asymmetric relationship between asset returns and inflation is plausible.
The effect of positive changes (increase) in inflation on asset returns (and company performance) is not likely to be the same as the effect of negative changes (decrease). It is likely that an increase in inflation will have a greater impact than a decrease in inflation, of the same magnitude (Isnandari & Chalid 2017:53-61). In short, the effect of inflation changes on asset returns is not symmetrical (constant) as assumed by the linear models used in most previous studies. It is likely to be asymmetrical, implying that positive and negative changes in inflation affect asset returns differently as companies are likely to respond faster to inflation increases than decreases (prices takes time to fall).
The inflation hedging capacity of an asset is evaluated using inflation beta (inflation coefficient in the regression model) as specified by the Fama and Schwert (1977:115-146) model. The coefficient is symmetric when linear models are used; implying that inflation increases and decreases have the same impact on nominal asset returns. Given the non-linear nature of economic relationships, linear models are not always appropriate in assessing the hedging capacity of different asset classes (Davari & Kamalian 2018:295-300; Katrakilidis, Lake & Trachanas 2012). Some asset classes might have been improperly categorised as inflation hedgers or otherwise, as a result of misleading evidence from the use of linear models. It is an economic possibility that some assets hedge inflation increases (firms increase their product prices when inflation rises), implying a positive relationship, but not inflation decreases (prices takes time to fall). The risk adverse investors are warier of inflation increases than inflation decreases (Isnandari & Chalid 2017:52-61). Capturing the asymmetric impact of inflation on asset returns is therefore crucial when assessing the hedging capabilities of any asset class. Asymmetric effects can be captured through the use of non-linear models as adopted in this study. Such an assessment will give investors and portfolio new insights into how they revise their portfolios to remain optimal. Monetary authorities in their endeavour to reduce inflation volatility might also draw some new perspectives on the extent to which investor wealth is exposed to vagaries of inflation.
The economic and financial characteristics of the infrastructure sector (derived from its oligopolistic and strategic pricing powers) make it better placed than other sectors when it comes to adjusting prices in line with changes in inflation (Wurstbauer & Schafers 2015:19-44). Deregulation is watering down these powers (Swedroe 2013). In times of financial turmoil, it might be possible to increase the price per unit, but depressed demand could result in decreased sales, resulting in the same earnings as before and after an inflation-adjustment in price (Brenchley 2019). For various reasons the inflation hedging capabilities of infrastructure investments is debatable, especially in emerging markets where the deregulation drive is gathering momentum.
There is little academic literature on the nexus between infrastructure investments and inflation and this issue is mainly covered in industry bulletins (First State Investments 2018). The few empirical studies that used basic statistical methods and linear models to evaluate infrastructure's ability to hedge inflation indicated the existence of both positive and negative relationships (Bird, Liem & Thorp 2014:802-824; Martin 2010:6-29; Peng & Newell 2007:423-450; Rödel & Rothballer 2012:110-123; Sawant 2010). Most of these studies were carried out in developed markets (United States of America (USA), United Kingdom (UK) and Australia) where the infrastructure market is well developed and mature. A gap therefore exists in terms of the methodology, asset class (infrastructure) and geographical area. With this in mind, the study used the non-linear autoregressive distributed lag (NARDL) model to determine the asymmetric capacity of infrastructure investments to hedge inflation in emerging markets where infrastructure is still developing and wild inflation bouts are the norm. For comparison purposes, the capacity of common listed stock and real estate was also assessed.
2. PROBLEM UNDER INVESTIGATION
Long term investors in emerging economies are in constant search for long-term inflation linked yields to meet their annuity inflation linked type of liabilities. The same applies to pensioners, employees and savers whose purchasing power is vulnerable to inflation shocks. Given the salivating, theoretical inflation hedging powers of infrastructure as a new asset class, investors, savers, portfolio managers and pensioners are likely to call the hunt off. This research article therefore examined the ability of infrastructure to hedge inflation shocks in developing economies so as to ascertain the ability of this new asset class to protect investors and related stakeholders from inflation shocks. Whereas previous studies considered only listed infrastructure investments, this present study added on private or unlisted infrastructure investments as well.
3. OBJECTIVES OF THE STUDY
The objectives of this present study are as follows:
■ Examine the asymmetric ability of infrastructure to hedge inflation in emerging economies.
■ Determine the extent to which real estate and general listed stock can act as inflation hedges in emerging nations.
■ Ascertain the level to which listed and private infrastructure can be treated as complimentary securities.
4. STRUCTURE OF THE ARTICLE
This article is structured as follows: the next section briefly reviews the theoretical and empirical literature on the inflation hedging abilities of infrastructure investments. Section three (3) discusses the procedures, tests and models used in this study to reveal the asymmetric inflation hedging abilities of infrastructure and other assets. The fourth section presents the findings from the tests and models. The final section offers conclusions, discusses the implications of the findings and provides recommendations.
5. LITERATURE REVIEW
There are two conflicting theories on the capacity of stocks to hedge inflation. The Fama and Schwert (1977:115-146) model assumes the existence of a positive relationship between nominal asset returns and inflation in perfect markets, implying that stocks hedge inflation. Restated, as compensation for increases in inflation, nominal stock returns must increase in tandem (Chang 2013:1305-1309). In contrast, Fama's (1981:545-564) 'proxy' hypothesis assumes that the relationship is negative, indicating that stocks lack capacity to hedge inflation. These theories are generally transposed to assess the inflation hedging capacity of any asset or commodity of interest in the short and long run (Lee 2014:61-65; Naser 2017:470-475).
The current study examined the asymmetric inflation hedging capabilities of infrastructure investments in emerging markets. The infrastructure sector is endowed with economic and financial features that are well suited to quell inflationary pressures (Wurstbauer & Schafers 2015:19-44). It is associated with utilities provision, oligopolistic and pricing powers (First State Investments 2018). Cash inflows from infrastructure investments such as utility and toll fees are often linked to inflation through concession agreements or regulation, implying that earnings from the infrastructure sector should hold up well in inflationary environments (Blanc-Brude 2018). Theoretically, this implies that infrastructure assets hedge positive inflation changes (Brenchley 2019; Rodel & Rothballer 2012:110-123).
Given its social, political and economic importance, the infrastructure sector is prone to regulatory changes and political interference (Inderst & Stewart 2014), which could dilute its oligopolistic powers and concessions (Swedroe 2013). Under such circumstances, the ability of infrastructure assets to hedge inflation becomes questionable as firms fail to adjust prices in line with inflation changes.
Empirical studies have reported conflicting conclusions on infrastructure's ability to hedge inflation. Basic statistical methods and linear models were used in almost all the available academic studies. Wurstbauer and Schafers (2015:19-44) employed USA data and concluded that direct infrastructure investments have partial inflation hedging capabilities in the short run but in the long run, are a good hedge. The investigation of the top five Australian infrastructure funds also suggested that infrastructure investments offer inflation protection as the returns were positive and above inflation (Colonial First State Global Asset Management 2009).
In contrast, Peng and Newell (2007:423-450) reported a negative (though insignificant) relationship between infrastructure investments (listed and unlisted) and inflation in Australia. This is in line with Martin (2010:6-29), who detected zero and negative correlations among listed infrastructure sectors in the US, save for energy which exhibited a positive relationship with inflation. Insignificant results were obtained using data from the USA and Australia (Bitsch, Buchner & Kaserer 2010:106-136; Sawant 2010).
6. DATA AND METHODOLOGY
This section presents the procedures and models applied in this research and the justification for the variables used and the tests adopted. The study used quarterly data from Morgan Stanley Capital International (MSCI) from 2009 to 2018, solely based on the fact that it provided the key variables required. The data is available for the emerging market category at index level. MSCI uses 24 emerging nations to come up with its indices, namely, Brazil, Peru, Chile, Columbia, Mexico, Czech Republic, Egypt, Hungary, Poland, Qatar, Russia, South Africa, Turkey, United Arab Emirates, China, India, Indonesia, Korea, Malaysia, Pakistan, Philippines, Taiwan, Greece and Thailand.
6.1 Variables of interest
The MSCI Emerging market infrastructure index captures listed stocks from the infrastructure sectors in the emerging nations listed above. The stocks are from companies that are directly involved in provision of a primary infrastructure product or service like energy and transport.
The MSCI Global quarterly private infrastructure index, also referred to as the Investment Property Databank (IPD) global quarterly infrastructure direct asset index, captures unlisted infrastructure investments. The global private index was used due to the unavailability (to the public) of private equity data in emerging markets. From the literature reviewed above, it seems that listed and unlisted infrastructure investments are significantly different in their stochastic behaviour; hence, the decomposition was deemed fit in this study.
For comparison purposes, this study examined the asymmetric hedging abilities of general listed stocks and real estate in emerging markets using the MSCI Emerging market stock market index and MCSI Emerging market real estate index, respectively.
The average consumer price index (CPI) for the 24 emerging nations was treated as a proxy for the inflation rate in developing economies. The real gross domestic product (GDP) growth rate and world Brent crude oil price changes were used as control variables.
Monthly returns for each asset class (real estate, listed infrastructure and common listed equity) were determined using the following formula:
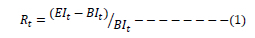
Rt is the return on asset class for month t, Elt is the asset class index value at the end of month t and Blt is the asset class index value at the beginning of month t. To ensure that all the variables were analysed at the same frequency, monthly returns were converted into quarterly returns using the Eviews' high to low frequency conversion procedure.
6.2 The empirical model
In evaluating the inflation hedging capabilities of infrastructure (and other asset classes), this study utilised the Fama and Schwert (1977:115-146) model derived from Fisher's (1930) hypothesis which stipulates that the nominal interest rate is equal to the real rate plus inflation. The Fama and Schwert (1977:115-146) model is presented in Equation 2:
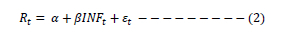
Rt is the nominal asset class return at time t, iNF is the actual inflation rate, α is the real return and ε is the error term (Wurstbauer & Schafers 2015:19-44). Parameter ß (inflation beta) explains the extent to which the asset in question hedges inflation. If the inflation beta is less than one but significantly different from zero, the asset is a partial hedge. The beta coefficient can be equivalent to one, indicating that the asset is a perfect/complete hedge, and if the coefficient is larger than one, the asset is more than a perfect inflation hedge (Isnandari & Chalid 2017:53-61).
Generally, the effect of independent variables on the dependent variable in most economic and financial cases takes time to take effect. In other words, the dependent variable responds with a lag (after some time). A change in the independent variable, like money supply, will effectively affect the dependent variable, like inflation, after some weeks if not months (Ghouse, Khan & Rehman 2018). Adjustment is unlikely to be instantaneous due to slower information dissemination, irrational investors and the informational inefficiency that characterise emerging markets (Babatunde 2017:129). On the same note, economic variables tend to be serially correlated because of their time series nature (ordered nature), inertia and momentum effect (Nkoro & Uko 2016:63-91). As such, static models will fail to reveal the relationships among variables and an autoregressive model is appropriate.
Economic variables tend to be non-stationary in nature, and differencing the variable is the common remedy for non-stationarity. Differencing the variable leads to the loss of long-run coefficients among the variables under consideration; hence, a model which captures both short- and long-run is appropriate (Mallick, Mallesh & Behera 2016:183-194; Mustafa & Selassie 2016:5). Traditional cointegration models such as Johansen and Juselius (1990:169-210) require that variables be integrated of the same order. In most instances, this is not the case; thus, a model which estimates long-run relationship using variables integrated of mixed orders is required (Babatunde 2017:129). The autoregressive distributed lag (ARDL) model suits all these features of economic series (Davari & Kamalian 2018:295-300; Pesaran, Shin & Smith 2001:289-326).
One limitation of the ARDL model is its assumption of linearity between the regressors and the regressand. This assumption does not hold in most financial and economic relationships as the variables are subject to violent fluctuations as well as structural breaks, and exhibit non-linear behaviour (Anoruo 2011:75-92; Po & Huang 2008:5535-5542; Saeed, Chowdhury, Shaikh, Ali & Sheikh 2018:408-422). The linear ARDL model ignores the likelihood that positive and negative changes in the regressors have a different impact and effect on the regressand (Nasr, Cunado, Demirer & Gupta 2018:94; Saeed et al. 2018:408-422). For these reasons it is logical to assume that positive and negative changes in inflation rates do not have the same effect on stock returns. If inflation increases, firms tend to respond quickly by adjusting the prices of their products and services upwards. In the case of a fall in inflation, they tend to adjust prices at a slower pace, if at all.
Previous studies such as (Isnandari & Chalid 2017; Lee 2014; Phiri 2016) on the hedging abilities of different asset classes produced mixed results - with both a positive and negative effect reported. This drives home the need for an asymmetric model which captures and separates positive and negative effects as a change in inflation might have a negative and sometimes a positive effect on stock returns. Traditional linear models assume that the dependent variable responds equally (in a symmetric manner) to both increases and decreases in the independent variable (Bildirici & Turkmen 2015:202-211; Saeed et al. 2018:408-422).
To address the issues highlighted above as well as the technical drawbacks of linear models, the study adopted the nonlinear ARDL (NARDL) model suggested by Shin, Yu and Greenwood-Nimmo (2014:281-314). The model makes use of positive and negative partial sum decompositions, thus enabling detection of the asymmetric effects in the long and short term. It must be emphasised that the nonlinearity or asymmetry is not in the sense that the parameters are quadratic or log-linear as is usually the norm. It is rather a decomposed linear relationship on the impact of the independent variable on the dependent variable in ARDL to ascertain whether positive and negative changes in the independent variable have a different effect on the dependent variable (Shin et al. 2014:281-314). As indicated by Bildirici and Turkmen (2015:202-211), asymmetry is one type of non-linearity. Under the NARDL model, a nonlinear relationship is a kind of relationship between two variables in which a change in one variable does not correspond with constant and symmetric change in the other variable (Bildirici & Turkmen 2015:202-211).
The usual ARDL model capturing both symmetric short- and long-run relationships considering the variables in this study can be expressed as follows:
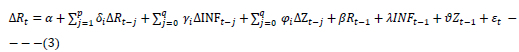
∆ is the first difference operator and p and q are the optimal lag length for the dependent variable (asset class returns) and independent variables (actual inflation rate and control variables), respectively. The parameters δ, ϕand γ are the short-run dynamics and coefficients ß, ϑ and λ represent the long-run dynamics of the model, whereas εt is the usual white noise residuals. R is the nominal returns of the asset class under study and INF is the actual inflation rate whereas Z captures the control variables. The significance of the parameters γ and λ determines the degree to which the asset class under study hedges inflation in the short and long run, respectively.
The NARDL model is an asymmetric extension of the linear ARDL approach to modelling short- and long-run relationships (Babatunde 2017:129; Nasr et al. 2018:94). In other words, once the negative and positive partial sums of inflation are added in model 3 above (ordinary ARDL model) it becomes a nonlinear ARDL (Saeed et al. 2018:408-422) model. The model corrects for endogeneity and serial correlation and is very simple to estimate. Katrakilidis and Trachanas (2012:1064-1069) noted that NARDL outperforms in testing cointegration in small samples, which was true in our case. The NARDL model allowed us to capture the hidden cointegration (non-linear cointegration), which is impossible with traditional techniques as they are based on the actual data and not the data decomposed into its positive and negative components (Nasr et al. 2018:94). NARDL models can be applied irrespective of whether the regressors are stationary at level or at the first difference. In order to avoid incorrect estimates and invalid F bounds tests, variables integrated of order two should not be used in a NARDL model (Chigusiwa, Bindu, Mudavanhu, Muchabaiwa and Muzambani 2011:119-129; Ibrahim 2015:1-14).
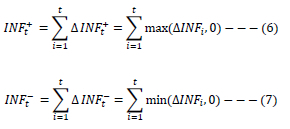
To capture the possible asymmetric effects of inflation on asset returns, the inflation rate is decomposed into partial sums of positive and negative change in the rate. The resultant NARDL short-run model is expressed as follows:
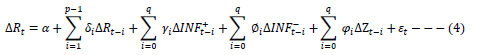
Is the partial sum of positive change in inflation, is the partial sum of negative change in inflation. The parameters and capture the ability of the asset class in question to hedge positive and negative changes in inflation. All other parameters remain the same as in Equation 3. The corresponding long run NARDL model is captured as follows:
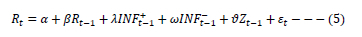
Captures the ability of the asset return in question to hedge positive inflation shocks in the long run, and specifies whether the asset class in question can hedge negative inflation changes in the long run. The partial sums of positive and negative processes of inflation, respectively, are expressed as follows:
Shin et al. (2014:281-314) noted that Pesaran et al.'s (2001:289-326) bounds testing approach is applicable and functional for Equation (5). The bounds test is used to calculate an F-statistic to determine whether there is a significant coefficient between asset returns and inflation (whether there is a long-run relationship between them). If the F-statistic is less than the critical values, the null hypothesis can be accepted, indicating the absence of a long-run effect. In contrast, if the F-statistic is greater than the critical values, the null hypothesis can be rejected (Davari & Kamalian 2018:295-300).
7. RESULTS AND DISCUSSION
The results obtained are presented under specific subheadings.
7.1 Descriptive Statistics
The general distribution of the variables of interest is presented in Table 1 below.
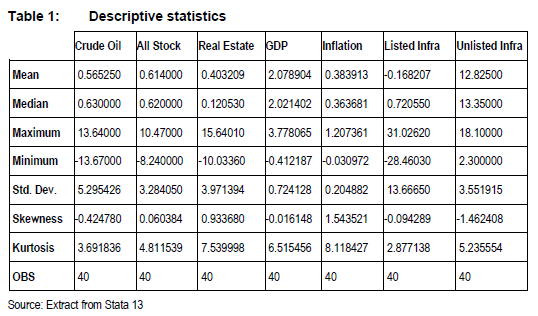
During the period under study, (2009-2018) the inflation rate in emerging markets averaged 0.38% which was very low and not a major threat to business firms and investors at large, as evidenced by positive GDP growth rates (2.08%) per quarter. Unlisted infrastructure investments earned the highest returns (12.83%) during this period, while the returns realised by investors in listed infrastructure investments were much lower (-0.168%) on average per quarter. This supports the claim that listed and unlisted infrastructure investments are complementary and display different stochastic behaviour. The highest level of volatility, measured by standard deviation, was noted in listed infrastructure which is contrary to the general belief that infrastructure investments provide steady, less volatile returns (otherwise stock markets are informationally inefficient). The least return swings were experienced by investors in general listed stock in emerging markets (3.28), indicating the power of diversification to reduce risk.
4.2 Correlation matrix
The bivariate correlations among the assets of interest are indicated in Table 2 below.
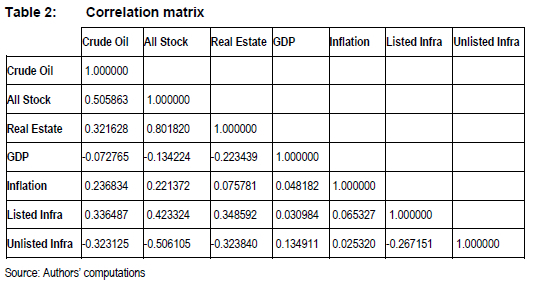
In harmony with the claim that listed and unlisted infrastructure investments are complementary, the relationship between them is negative (-0.267). The evidence from the bivariate correlations indicates the possibility that infrastructure investments hedge inflation as both coefficients are positive. The correlation between unlisted infrastructure and other assets is negative indicating that unlisted infrastructure investments exist in a class of their own. Surprisingly, the correlation between GDP and aggregate stock returns (all stock) is negative in emerging markets. This is an indication of the inability of stock market returns to reflect or mirror economic growth in emerging economies. It is spurred by the insignificant number of companies (in comparison to the economy) listed given that the economies of most emerging nations are driven by the informal sector and small to medium size enterprises which are not listed on stock markets. The negative relationship can also be explained by the fact that, when the economy (GDP) is performing well, investors shun the stock market (resulting in depressed returns) as they become involved in real economic activity and rejoin the stock exchange when the economy is depressed (when real economic activity is threatened), resulting in positive returns.
4.3 Stationarity tests
Stationarity tests were carried out to avoid spurious regression and to validate the use of the NARDL model; the results thereof are presented in Table 3 below. To counter the weaknesses associated with common unit root tests like low power and biased results in small samples, the study applied four tests including the Ng-Perron test which is valued for its reliability and consistency (Chigusiwa et al. 2011:119-129).
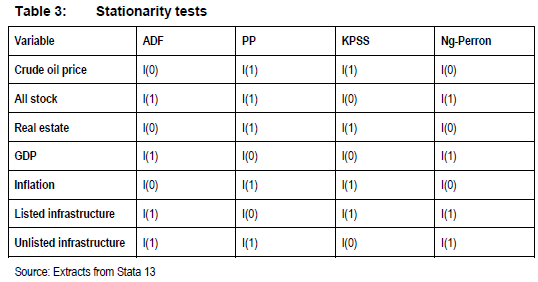
The results from the unit root and stationarity tests indicated that none of the variables is integrated of order two, thereby substantiating the use of the NARDL model.
4.4 Parameter estimation
As four assets were under investigation, each was separately assessed and the results were captured under four models to assess asymmetric inflation hedging ability. Each model addresses a single asset's ability to hedge asymmetric inflation. The number of lags included in each model was specified using the Akaike Information Criteria.
4.4.1 Model 1 - asymmetric inflation hedging ability of unlisted infrastructure
The first model evaluated the hedging capabilities of unlisted infrastructure. The estimates from Model 1 are presented in Table 4 below.
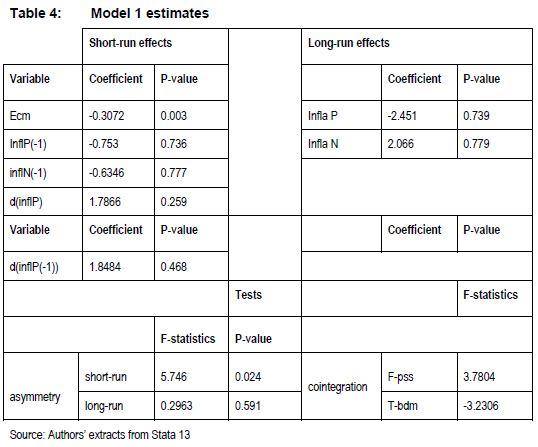
From Table 4 above, the only significant coefficient worth noting is the short-run asymmetry, indicating that in the short run, positive and negative changes to inflation have a different effect or impact on unlisted infrastructure investments. Unlisted infrastructure investments failed to exhibit any significant capacity to hedge either positive or negative inflation shocks, both in the short and long run which is contrary to Wurstbauer and Shafers (2015:19-44). Although the effects are not significant, the impact of positive changes in inflation is negatively related to unlisted infrastructure investments' performance (-2.451) in the long run in support of the proxy hypothesis. Negative shocks to inflation lead to positive changes in unlisted infrastructure investments' performance. The long-run relationship between unlisted infrastructure and inflation was confirmed by the existence of a significant error correction term given that the F-test results are inconclusive.
4.4.2 Model 2 - asymmetric inflation hedging ability of listed infrastructure
The results of the evaluation of the asymmetric inflation hedging ability of listed infrastructure are shown in Table 5 below.
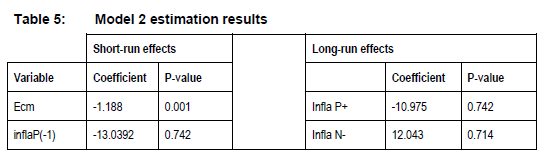
The impact of negative and positive inflation shocks is mixed in the short run (positive and negative). In the long run, the effects are the same as those for unlisted infrastructure. It must be emphasised that the coefficients are insignificant save for the long-run relationship, although correction towards a long-run relationship is very marked. These results suggest that, listed infrastructure is not a good hedge against inflation and that the effect of inflation on listed infrastructure is symmetrical in the short and long run. The findings are in tandem with those obtained by Peng and Newell (2007:423-450) and Bird et al. (2014:802-824).
4.4.3 Model 3 - asymmetric inflation hedging ability of real estate
The asymmetric inflation hedging ability of real estate was examined for comparison purposes and the results are displayed in Table 6.
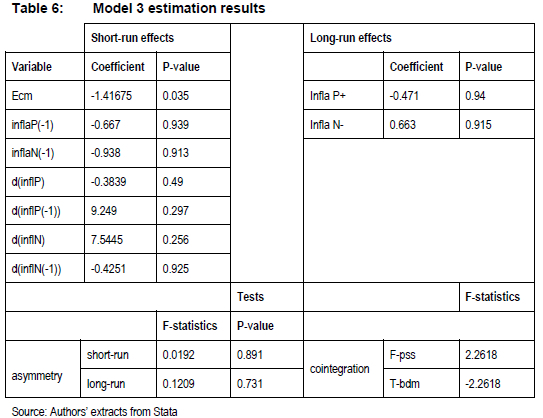
The results indicate the absence of asymmetry in the short and long run. Like listed infrastructure, in emerging markets, real estate cannot hedge inflation in the short and long run. The results are in disharmony with the Fama and Schwert model of 1977.
4.4.4 Model 4 - asymmetric inflation hedging capability of general equity
The results from the final model where the general listed stock in emerging markets was treated as the asset of interest are presented in Table 7.
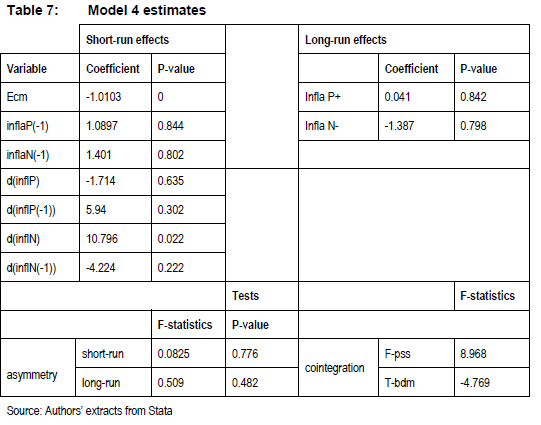
Although a long-run relationship was noted between general listed equity and inflation, general equity failed to hedge inflation partial sums.
In summary, the existence of short- and long-run asymmetry was noted between unlisted infrastructure and decomposed inflation. Other asset classes indicated the existence of symmetric effects in the short and long run. In all the models, the effect of long-run positive and negative inflation shocks on the respective asset was positive and negative, respectively (though insignificant).
8. CONCLUSIONS
The study evaluated the ability of infrastructure investments to hedge asymmetric inflation in emerging markets using quarterly data from 2009 to 2018. Infrastructure investments were decomposed into listed and unlisted investments as their stochastic distributional features and performance are claimed to differ significantly. The NARDL model was adopted to capture the asymmetric inflation hedging capacity of infrastructure investments in the short and long run. The asymmetric inflation hedging capabilities of real estate and general listed stock in emerging markets were also evaluated for comparison purposes.
As per the stated objectives, the findings indicated that infrastructure investments (listed and unlisted) in emerging markets are not asymmetric inflation hedgers. Restated, it is a myth to claim that infrastructure investments hedge inflation in emerging markets. The same can be said of real estate and general listed equity. In the short run, unlisted infrastructure exhibited an asymmetric response, implying that it responded differently to negative and positive inflation shocks. In all the other asymmetric tests, the results were insignificant (although all long-run coefficient signs indicated some asymmetries). A long-run relationship was noted between inflation and all the assets under consideration save for real estate. Listed and private infrastructure exhibited different distributional features and different risk-return profiles in emerging economies. As such it is safe to conclude that it is an investment myth to categorise infrastructure, real estate and general listed stock returns as inflation hedges in emerging economies. Similarly, it can be carefully concluded that listed and unlisted infrastructure are complementary.
9. RECOMMENDATIONS
Managers interested in hedging inflation are recommended to look beyond infrastructure, general listed stocks and real estate in emerging markets. Risk managers can consider the use of derivatives and commodities such as gold and other inflation indexed securities in order to shield their assets from inflation risk.
Portfolio and asset managers are encouraged to include listed and private infrastructure in the same portfolio as their distributional features are different and can generate positive benefits to such managers. In their attempt to hedge inflation risk, managers are hereby encouraged to remember equally important investment goals such as total income and capital growth.
In light of the heterogeneous nature of emerging economies in terms of political risks, economic development and regulatory frameworks, future studies could conduct individual country analysis. Unfortunately, very little data is available on infrastructure returns in individual nations.
10. IMPLICATIONS TO STAKEHOLDERS
The results imply that investors cannot hedge positive and negative inflation shocks using infrastructure investments, general stocks and real estate investments in emerging markets. Inflation risk managers require in-depth analysis in their operations as the market is laden with unsubstantiated claims and myths. In other words, quantitative analysis tools must be embraced by risk managers so that they create and maintain company value. The different stochastic and distributional properties of listed and unlisted infrastructure investments imply that investors and portfolio managers can realise some risk diversification benefits by including listed and unlisted infrastructure in the same portfolio. The lack of inflation hedging assets in emerging markets imply that monetary authorities need to keep inflation under check so as to protect investor wealth and attract more investments. In other words, these managing authorities must be creative to attract new capital into the infrastructure sector. Such financial securities include inflation indexed securities and exchanged traded funds. The management fraternity, appreciation of creativity, quantitative analysis and evaluation of financial claims and myth goes a long way in creating and maintaining firm value.
REFERENCES
ANG A, BRIÈRE M & SIGNORI O. 2012. Inflation and Individual Equities. Financial Analysts Journal 68(4):36-55. (DOI:https://doi.org/10.2469/faj.v68.n4.3. [ Links ])
ANORUO E. 2011. Testing for linear and nonlinear causality between crude oil price changes and stock market returns. International Journal of Economic Sciences & Applied Research 4(3):75-92. [Internet:https://papers.ssrn.com/sol3/papers.cfm?abstract_id=1978873; downloaded on 17 July 2019. [ Links ]]
AUSTIN A, & DUTT S. 2016. Do stock returns hedge inflation at long horizons? Applied Economics Letters 23(13):936-939. (DOI:https://doi.org/10.1080/13504851.2015.1122725. [ Links ])
BABATUNDE MA. 2017. Trade Openness and Inflation in Nigeria: A Nonlinear ARDL Analysis. Journal of Economics and Sustainable Development 8(24):1-20. [Internet:https://www.semanticscholar.org/paper/Trade-Openness-and-Inflation-in-Nigeria%3A-A-ARDL-Babatunde/53a9766e7612378ff68fe791db9933daff18180d; downloaded on 15 September 2019. [ Links ]]
BILDIRICI ME & TURKMEN C. 2015. Nonlinear causality between oil and precious metals. Resources Policy 46:202-211. (DOI:https://doi.org/10.1016/j.resourpol.2015.09.002. [ Links ])
BIRD RG, LIEM H & THORP S. 2014. Infrastructure: Real assets and real returns. European Financial Management 20(4):802-824. [Internet:https://papers.ssrn.com/sol3/papers.cfm?abstract_id=2496685; downloaded on 17 February 2019. [ Links ]]
BITSCH F, BUCHNER A, & KASERER C. 2010. Risk return and cash flow characteristics of infrastructure fund investment. European Investment Bank Papers 15(1): 106-136 [Internet:https://www.econstor.eu/bitstream/10419/45366/1/657029866.pdf; downloaded on 22 January 2019. [ Links ]]
BLANC-BRUDE F. 2018. The fair value of unlisted infrastructure investments. Paris, France: EDHEC Infrastructure Institute, LTIIA Annual Meeting. [Internet:https://2018.parisinfraweek.com/sites/default/files/materials/ltiia_mc_oct_2018.pdf; downloaded on 23 June 2019. [ Links ]]
BRENCHLEY D. 2019. Why now is the time to invest in infrastructure. Morningstar. [Internet:http://www.morningstar.co.uk/uk/news/173214/why-now-is-the-time-to-invest-in-infrastructure.aspx; downloaded on 24 June 2019]. (January 11. [ Links ])
BRIERE M, & SIGNORI O. 2011. Hedging Inflation Risk in a Developing Economy. Working Paper Amundi Asset Management (7) - May 2011. [Internet:https://www.amundi.com/doc_download&file=5113081435546626640_5113081435545023231; downloaded on 20 June 2019. [ Links ]]
CHANG H-F. 2013. Are 'stock returns' a hedge against inflation in Japan? Determination using ADL bounds testing. Applied Economics Letters 20(14):1305-1309. (DOI:https://doi.org/10.1080/13504851.2013.806772. [ Links ])
CHIGUSIWA L, BINDU S, MUDAVANHU V, MUCHABAIWA L & MUZAMBANI D. 2011. Export-Led Growth Hypothesis in Zimbabwe: Does Export Composition Matter? International Journal of Economic Resources 2:111-129. [Internet:https://pdfs.semanticscholar.org/aa51/422694b2319f2727635136cbb5bb9f893ce3.pdf; downloaded on 22 June 2019. [ Links ]]
COLONIAL FIRST STATE GLOBAL ASSET MANAGEMENT. 2009. Changing gears: Navigating the road ahead in infrastructure. Sydney, CFSGAM. [Internet:www.firststateinvestments.com; downloaded on 12 January 2018. [ Links ]]
FAMA EF. 1981. Stock returns, real activity, inflation and money. American Economic Review 71:545-564. [Internet:https://www.jstor.org/stable/1806180?seq=1#metadata_info_tab_contents; downloaded on 03 August 2019. [ Links ]]
FAMA EF & SCHWERT GW. 1977. Asset returns and inflation. Journal of Financial Economics 5(2):115-146. (DOI:https://doi.org/10.1016/0304-405X(77)90014-9. [ Links ])
FIRST STATE INVESTMENTS. 2018. INFRASTRUCTURE AS A HEDGE TO INFLATION. [Internet:https://www.firststateinvestments.com/emea/articles-uk-documentation/GLIS%20Infrastructure%20hedge%20to%20inflation.pdf; downloaded on 21 August 2019. [ Links ]]
FISHER I. 1930. The Theory of Interest. New York: Macmillan. [ Links ]
GHOUSE G, KHAN SA & REHMAN RU. 2018. ARDL model as a remedy for spurious regression: problems, performance and prospectus. [Internet:https://mpra.ub.uni-muenchen.de/83973/; downloaded on 03 August 2019. [ Links ]]
DAVARI H & KAMALIAN A. 2018. Oil Price and Inflation in Iran: Non-linear ARDL Approach. International Journal of Energy Economics and Policy 8(3):295-300. [Internet:https://ideas.repec.org/a/eco/journ2/2018-03-35.html; downloaded on 23 July 2019. [ Links ]]
IBRAHIM MH. 2015. Oil and food prices in Malaysia: A nonlinear ARDL analysis. Agricultural and Food Economics 3(1):1-14. (DOI:https://agrifoodecon.springeropen.com/articles/10.1186/s40100-014-0020-3. [ Links ])
INDERST G & STEWART F. 2014. Institutional investment in infrastructure in emerging markets and developing economies. Report number: 91307. Washington, DC. Public-Private Infrastructure advisory facility - World Bank. [Internet:http://documents.worldbank.org/curated/en/748551468337163636/Institutional-investment-in-infrastructure-in-emerging-markets-and-developing-economies; downloaded on 20 July 2019. [ Links ]]
ISNANDARI ML & CHALID DA. 2017. Stock Returns and Inflation: Evidence from Emerging Markets in Asia. Indonesian Capital Market Review 9:53-61. [Internet:http://journal.ui.ac.id/index.php/icmr/article/download/8554/3978; downloaded on 10 August 2019. [ Links ]]
JOHANSEN S & JUSELIUS K. 1990. Maximum likelihood estimation and inference on cointegration - with applications to the demand for money. Oxford Bulletin of Economics and Statistics 52 (2):169-210. [DOI:https://onlinelibrary.wiley.com/doi/abs/10.1111/j.1468-0084.1990.mp52002003.x; downloaded on 14 May 2019. [ Links ]]
KATRAKILIDIS K, LAKE AE & TRACHANAS E. 2012. Asymmetric Effects of Inflation on Stock Market Prices: New Empirical Evidence Using Greek Data. Journal of Applied Business Research 28(3):23-40. (DOI:https://doi.org/10.19030/jabr.v28i3.6952. [ Links ])
KATRAKILIDIS K & TRACHANAS E. 2012. What drives housing price dynamics in Greece: New evidence from asymmetric ARDL cointegration. Economic Modelling 29(4):1064-1069. (DOI:https://doi.org/10.1016/j.econmod.2012.03.029. [ Links ])
LEE CL. 2014. The inflation-hedging characteristics of Malaysian residential property. International Journal of Housing Markets and Analysis 7:61-75. (DOI:https://doi.org/10.1108/IJHMA-10-2012-0053. [ Links ])
MALLICK L, MALLESH U & BEHERA J. 2016. Does tourism affect economic growth in Indian states? Evidence from panel ARDL model. Theoretical and Applied Economics XXIII 1(606):183-194. [Internet:https://econpapers.repec.org/scripts/redir.pf?u=http%3A%2F%2Fstore.ectap.r o%2Farticole%2F1170.pdf;h=repec:agr:journl:v:xxiii:y:2016:i:1(606):p:183-194; downloaded on 24 May 2019. [ Links ]]
MARTIN GA. 2010. The Long-Horizon Benefits of Traditional and New Real Assets in the Institutional Portfolio. The Journal of Alternative Investments 13:6-29. (DOI:https://doi.org/10.3905/jai.2010.13.1.006. [ Links ])
MORGAN STANLEY CAPITAL INTERNATIONAL (MSCI). 2019. MSCI Emerging Markets index. [Internet:https://www.msci.com/emerging-markets; downloaded on 14 January 2019. [ Links ]]
MUSTAFA M & SELASSIE HS. 2016. Macroeconomic dynamics of income growth: Evidence from ARDL bound approach, GMM and Dynamic OLS. European Journal of Business,Economics and Accountancy 4(5):60-74. [Internet:https://www.idpublications.org/wp-content/uploads/2016/05/Full-Paper-MACROECONOMIC-DYNAMICS-OF-INCOME-GROWTH-EVIDENCES-FROM-ARDL-BOUND-APPROACH.pdf; downloaded on 25 June 2019. [ Links ]]
NASER H. 2017. Can Gold Investments Provide a Good Hedge Against Inflation? An Empirical Analysis. International Journal of Economics and Financial Issues 7(1):470-475. [Internet:https://www.google.com/url?sa=t&rct=j&q=&esrc=s&source=web&cd=1&cad= rja&uact=8&ved=2ahUKEwjC-HCjcnoAhWnTxUIHSaXCn0QFjAAegQIBhAB&url=https%3A%2F%2Fwww. econjournals.com%2Findex.php%2Fijefi%2Farticle%2Fdownload %2F3716%2Fpdf&usg=AOvVaw06aJm6kLJ4snrxg_2l-D3K; downloaded on 05 August 2019. [ Links ]]
NASR AB, CUNADO J, DEMIRER R & GUPTA R. 2018. Country Risk Ratings and Stock Market Returns in Brazil, Russia, India, and China (BRICS) Countries: A Nonlinear Dynamic Approach. Risks 6(3): 1 -22. (DOI:https://doi.org/10.3390/risks6030094. [ Links ])
NKORO E & UKO AK. 2016. Autoregressive Distributed Lag (ARDL) cointegration technique: application and interpretation. Journal of Statistical and Econometric Methods 5(4):63-91. [Internet:http://www.scienpress.com/Upload/JSEM%2FVol%205_4_3.pdf; downloaded on 16 May 2019. [ Links ]]
PENG HW & NEWELL G. 2007. The significance of infrastructure in Australian investment portfolios. Pacific Rim Property Research Journal 13:423-450. (DOI:https://doi.org/10.1080/14445921.2007.11104240. [ Links ])
PESARAN MH, SHIN Y & SMITH RJ. 2001. Bound testing approaches to the analysis of level relationships. Journal of Applied Econometrics 16:289-326. (DOI:https://doi.org/10.1002/jae.616. [ Links ])
PHIRI A. 2016. Long run equilibrium adjustment between inflation and stock market returns in South Africa: A nonlinear perspective. Munich Personal RePEc Archive. [Internet:https://mpra.ub.uni-muenchen.de/id/eprint/70260; downloaded on 27 July 2019. [ Links ]]
PO W-C & HUANG B-N. 2008. Tourism development and economic growth - a nonlinear approach. Physica A: Statistical Mechanics and its Applications 387(22):5535-5542. [Internet:https://ideas.repec.org/a/eee/phsmap/v387y2008i22p5535-5542.html; downloaded on 25 August 2019]. (DOI:10.1016/j.physa.2008.05.037. [ Links ])
RÖDEL M & ROTHBALLER C. 2012. Infrastructure as Hedge against Inflation-Fact or Fantasy? Journal of Alternative Investments 15(1):110-123. (DOI:https://doi.org/10.3905/jai.2012.15.1.110. [ Links ])
SAEED MM, CHOWDHURY MAF, SHAIKH GM, ALI M & SHEIKH SM. 2018. Asymmetric impact of oil prices, exchange rate, and inflation on tourism demand in Pakistan: new evidence from nonlinear ARDL. Asia Pacific Journal of Tourism Research 23(4):408-422. [DOI:https://www.tandfonline.com/doi/full/10.1080/10941665.2018.1445652; downloaded on 20 May 2019. [ Links ]]
SAWANT RJ. 2010. Infrastructure Investing. Managing risk & rewards for pensions, insurance companies & endowments. 1st Ed. Hoboken, NJ: John Wiley & Sons. [ Links ]
SHIN Y, YU B & GREENWOOD-NIMMO M. 2014. Modelling Asymmetric Cointegration and Dynamic Multipliers in a Nonlinear ARDL Framework. Festschrift in honor of Peter Schmidt (pp 281-314). New York. (DOI:https://link.springer.com/chapter/10.1007/978-1-4899-8008-3_9. [ Links ])
SWEDROE L. 2013. Swedroe: Infrastructure as inflation hedge-Not. ETF.com June 24 2013. [Internet:https://www.etf.com/sections/index-investor-corner/19041-swedroe-infrastructure-as-inflation-hedgenot.html; downloaded on 20 June 2019. [ Links ]]
WURSTBAUER D & SCHAFERS W. 2015. Inflation hedging and protection characteristics of infrastructure and real estate assets. Journal of Property Investment & Finance 33 (1):19-44. (DOI:https://doi.org/10.1108/JPIF-04-2014-0026. [ Links ])
* corresponding author
