


Services on Demand
Journal

Article
 English (pdf)
 Article in xml format
 Article references
 Send this article by e-mail
Indicators
Related links
-
 Cited by Google
 -
 Similars in Google
Share

 Permalink
Journal of Energy in Southern Africa
On-line version ISSN 2413-3051Print version ISSN 1021-447X
J. energy South. Afr. vol.32 n.1 Cape Town Feb. 2021
https://doi.org/10.17159/2413-3051/2021/v32i1a7792
ARTICLES
Lesotho electricity demand profile from 2010 to 2030
M. MpholoI, II, *; M. MothalaI, II; L. MohasoaI, III; D. EagerIV; R. ThamaeI, V; T. MolapoI; T. JardineVI
IEnergy Research Centre, National University of Lesotho, Lesotho
IILaboratory for Research on the Structure of Matter, University of Pennsylvania, Philadelphia, USA
IIILesotho Electricity Company, Maseru, Lesotho
IVWood Mackenzie Power and Renewables (Europe), Edinburgh, UK
VDepartment of Economics, National University of Lesotho, Lesotho
VIEnergy Market and Regulatory Consultants, Edinburgh, UK
ABSTRACT
This study undertook a 2010 to 2030 electricity demand profile for Lesotho, with 2010 used as the base year. The demand forecast was modelled using the International Atomic Energy Agency Model for Analysis of Energy Demand, largely because of its proven ability to accurately forecast demand in developing economies based on socio-economic, technology and demography variables. The model correlates well with the actual data, where data exists, and predicts that by 2030 Lesotho will achieve a national electrification rate of 54.2%, with 95% for urban households and 14% for rural households, up from 19.4%, 54.1% and 1.8% respectively in the base year. Moreover, in the same period, the forecast for the most likely scenario gives the following results: the maximum demand will increase to 211 MW from 121 MW; the annual average household energy consumption will continue its decline to 1 009 kWh/household from 1 998 kWh/household; and the total consumption will increase to 1 128 284 MWh from 614 868 MWh. The overall low growth rate is attributed to the consistently declining average household consumption that is contrary to international norms. The forecast results gave a root mean square percentage error of 1.5% and mean absolute percentage error of 1.3%, which implied good correlation with the actual data and, hence, confidence in the accuracy of the results.
Highlights
Between 2030 and 2010:
• Achievement of national electrification rate of 54.2% up from 19.4%.
• Electrification: 95% urban, 14% rural households, from 54.1% and 1.8% respectively.
• The maximum demand will increase to 211 MW from 121 MW.
• Annual average household consumption will decline to 1 009 kWh/household from 1,998 kWh/household.
Keywords: MAED; energy demand forecast; electrification rate; declining average household consumption.
1. Introduction
Access to electricity is a key success factor in every economy. In Lesotho, the national electrification rate has reached 41% of households (Lesotho Electricity and Water Authority (LEWA) 2018), and that calls for more efforts to be geared towards electrification to provide for the remaining 59% of households, mostly in the rural areas of the country. At present only about 10% of rural households are grid-connected, compared to about 80% of urban households. Furthermore, as Lesotho embarks on its journey of industrialisation, in a quest for an improved level of economic development, the national demand for power is increasing. According to LEWA (2017), Lesotho reached peak demand of 161 MW. With a national installed generation capacity of approximately 74 MW, this leaves the country with a huge supply deficit (LEWA, 2018). Hence a greater need for a robust supply and demand balance. The key factor in establishing a reliable and sustainable demand and supply balance lies with proper planning and forecasting of the country's energy demand.
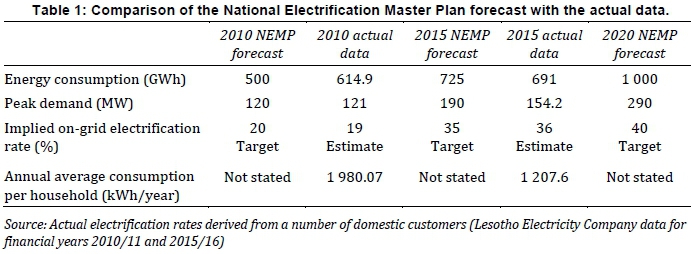
Currently, the only official demand forecast for Lesotho is found in the 2007 National Electrification Master Plan (NEMP) from 2005 to 2020 (Government of Lesotho 2007). A key driver of the NEMP forecast was meeting the government electrification rates targets of 35% by 2015 and 40% by 2020. A comparison of forecasted and actual main parameters and key drivers is depicted in Table 1. The comparison for 2010 shows that the realised peak demand (120 MW forecast versus 121 MW actual) and electrification rates (20% targeted versus 19% actual) were close to the forecast. Other parameters show less alignment, such as the total energy consumption (i.e., energy sales in the Lesotho Electricity Company (LEC) data), which was higher than forecast. Thus, there is a need for the revised electricity demand forecasts that will address both the shortfalls of the NEMP and forecast demand beyond 2020.
According to the literature, it is imperative that energy demand forecasting is done with minimal errors, as the consequences of such errors could be very costly for a utility or country. For example, underestimating electricity demand could result in supply shortages which in turn cause blackouts. In South Africa the cost of unserved electricity was estimated around USD 0.3/kWh in 2013 for a household (Minnaar et al., 2017) compared to an average unit cost of USD 0.077/kWh in 2019 (TimesLive, 2019); and for Lesotho the value could be as high as USD 0.75-1.0/kWh. On the other hand, overestimating the demand could result in excessive investment in infrastructure towards capacity expansion (Steinbuks, 2019). The cost of the investment translates back to consumers via increased tariffs due to increased capital and operating costs. Since it is expensive to store power, this could end up costing the utility to pay neighbouring countries to dump its excess power. In light of these potential problems, selecting the right modelling tool and approach for energy demand forecasting is critical (Suganthi and Samuel, 2012).
Many energy demand forecast models have been developed, with quantitative ones ranging from econometric to accounting (or end-use) models. A wide literature review of these models is given in Suganthi and Samuel (2012) but without any focus on a specific country. In the case of Lesotho, an econometric model, the autoregressive integrated moving average (ARIMA), is employed for long-term electricity demand forecast (Senatla et al., 2018). The forecast is done from 2016 to 2050, assuming two scenarios for predetermined growth rate in electricity consumption. However, Al-Mu-saylh et al. (2018) report that ARIMA tends to have large errors in long-term demand forecasting and is useful only for the short term. This is primarily because the model uses stationary data and assumes that the demand fluctuates around the mean value. This assumption clearly ignores socio-economic changes and structural changes that may occur in the long run and therefore can give huge errors, especially for developing countries (Bhattacharyya and Timilsina, 2009). In an attempt to incorporate some of the socio-economic parameters, Adeoye and Spataru (2019) employ multiple regression analysis to forecast hourly demand of West African Power Pool countries. The model is first approached using a bottom-up framework, by considering urban and rural household electricity consumption and electrification rates, among other parameters, to construct an hourly demand profile. Second, the non-residential sector is modelled using a top-down approach by aggregating the industry to an annual load then modelling the hourly demand from the forecasted annual load profile. The model achieves 15% error relative to the actual demand. Aman et al. (2011) use a similar strategy of both bottom-up and top-down methodologies using multiple regression analysis in the Malaysian steel industry to model hourly electricity demand and achieves a mean absolute percentage error (MAPE) of 2.3%.
Alternatively, Bhattacharyya and Timilsina (2010a) conduct a wide energy system models that have largely been used in developing countries. It is concluded that econometric models are less suitable for developing countries than end-use models, due to structural changes often found in developing countries. Steinbuks (2019) agrees with this observation, suggesting that modelling in developing countries such as those in Sub-Saharan Africa can best be done using disaggregated data, although the challenge may be its availability. Finally, Bhattacharyya and Timilsina (2010b) assess the specific features of developing countries that need to be captured in energy modelling. The study compares four models on their suitability for developing countries and these are: Model for Analysis of Energy Demand (MAED), Long-range Energy Alternative Planning (LEAP), Prospective Outlook on Long-term Energy Systems (POLES) and World Energy Model (WEM). MAED and LEAD are both bottom-up accounting models while POLES and WEM are hybrid accounting and econometric models. POLES and WEM require a high level of skill to use and have limited coverage of rural energy - two limitations that make them less suitable for developing countries. Moreover, the end-use models can create scenarios that can capture non-price policies and any structural shifts.
Hainoun et al. (2006) also employ a bottom-up approach using Model for Analysis of Energy Demand - Energy Demand module (MAED_D) to forecast the long-term energy demand of Syria. The model employs three possible scenarios aimed at capturing the possible socio-economic and technical evolution of the country. It was found that the consumption of electricity increased at a rate higher than the final energy demand of the country, owing to increased automation in industry and an increase in household electricity consumption for all scenarios, and the growth rate of consumption is lower than the growth rate of GDP. The study was followed by another, forecasting the electricity demand profile of the country using the second module of MAED, MAED_EL (EL = Electricity), to determine future peak demand (Hainoun, 2009). Similar results were obtained in a study in Tanzania by Kichnoge et al. (2014) using MAED, where the rate of growth of electricity demand is highest for industry. A possible explanation for the trend is that these are developing economies.
It is against this background that the paper aims to present the current electricity demand profile and the modelled forecasts expected in Lesotho up to the year 2030 using MAED, developed by the International Atomic Energy Agency. The demand profile is critical for several reasons, including: to aid relevant planning departments in determining the appropriate medium-to-long-term development programmes; to set tariffs at the right level; to help the government to come up with informed policies (such as setting realistic targeted electrification rates); and to inform investors in the sector of the size of the market, hence potential investment opportunities. The demand forecast to 2030 is considered as a realistic target date for analysis primarily due to uncertainty as to the future grid roll-out methodology in Lesotho. There are likely to be significant reductions in grid expansions in the future, with a major switch to off-grid solar home and mini-grid solutions, as per the draft off-grid masterplan currently under review. Moreover, there are currently no committed generation expansion projects. Therefore, it could be misleading to project beyond 2030.
The results presented in this paper are part of the cost of service study undertaken in 2018 for LEWA, with the raw data obtained from LEC for the period 2000 to 2017. Since 2017 to date, there has not been any significant change in terms of the data on customer movements and consumption. For instance, the average consumption per household continues its decline trajectory, from 1 157 kWh/ year in 2016/17 to 1 117 kWh/year in 2018/19, which goes to corroborate the results discussed further in this paper.
The paper is arranged such that the next section discusses the current demand profile derived from the actual data. Section 3 talks about the methodology used to determine the forecasts which is then followed by the section of the forecast results. Section 4 gives conclusions. The various MAED input tables and data are available separately from the online home page of the article.
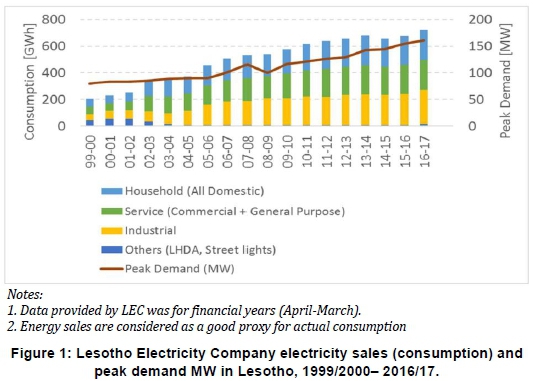
2. Current demand profile
The analysis of the recent electricity demand provided by the utility company Lesotho Electricity Company (LEC) (energy purchases, energy sales and peak demand) from 2000 to 2016 is shown in Figure 1. The graph shows that the overall consumption and peak demand have increased over the period (the graph shows a dip in consumption during 2014/15, but it has since continued to grow). More precisely, since 2001/02 the peak demand has increased by 93% (83.5 MW to 161.0 MW) and total consumption by 186% (257.9 GWh to 737.3 GWh).
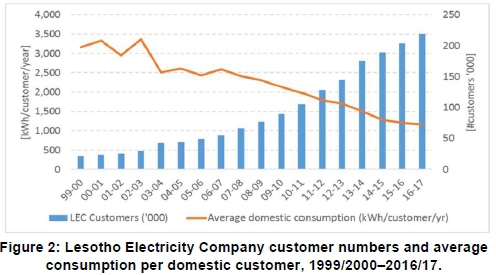
A key driver for this increase in demand has been the connection of new customers. Figure 2 shows how the LEC customer base has increased by almost a factor of 10 from around 25 000 in 2001/02 to approaching 210 000 in 2016/17, although the average consumption per household has decreased by over 60% during the same period (2 951 to 1 157 kWh/year). The causes for this situation were looked into critically and it was found that affordability for the majority of the households that are recently being connected to the grid is the major reason: it results in very low consumption, hence continually reducing the average consumption (Mpholo et al., 2020).
2.1 Daily load curves and seasonal profiles
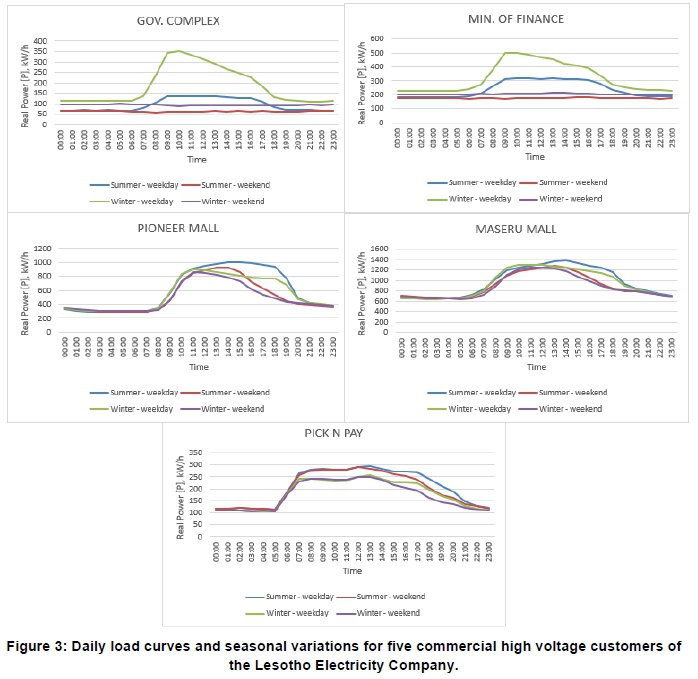
Figure 3 shows the daily load curves for typical workdays for five major commercial high voltage (HV) customers. There are around 40 commercial HV customers in total. It shows how some commercial activities have more demand during business hours on weekdays, with a flat and lower profile at weekends. There are similar weekday profiles in summer and winter, although the absolute values of demand are higher in winter.
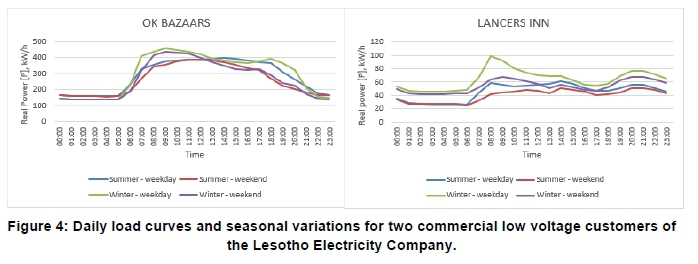
Figure 4 shows the daily load curves for typical workdays for two major commercial low voltage (LV) customers, of which there are around 200 in total. These profiles are similar between weekdays and weekends and within seasons.
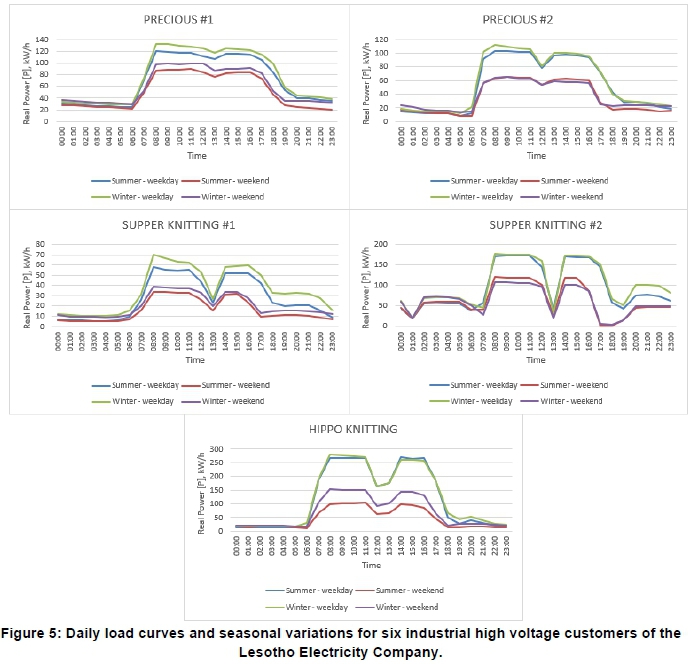
Figure 5 shows the daily load curves for typical workdays for six major industrial high voltage (HV) customers, of which there are around 45 in total. These profiles are quite flat and, on the whole, winter demand is lower than summer.
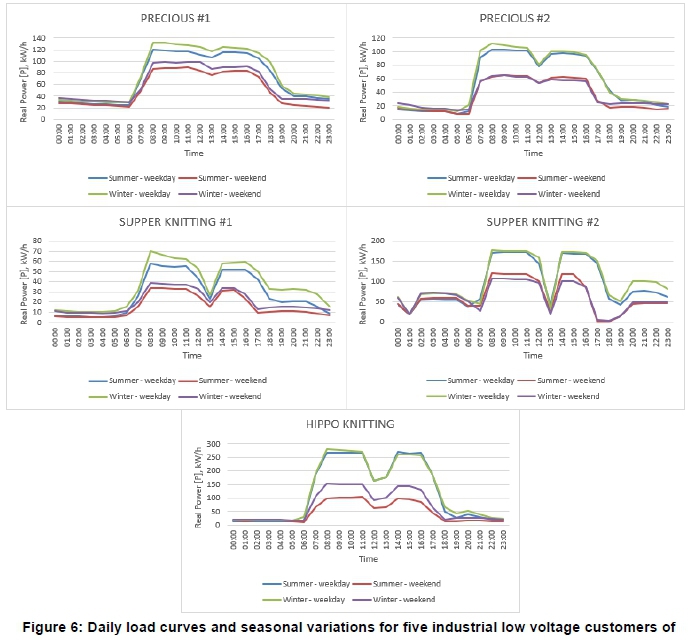
Figure 6 shows the daily load curves for typical workdays for five major industrial low voltage (LV) customers, of which there are around 175 in total. These profiles have a similar shape throughout the year, with winter demand higher than summer. There is also a distinct drop around the middle of the day - most likely coinciding with staff lunch breaks.
2.2 System load factor
Figure 7 shows a plot of the system load factor for 2015 and 2016. The average system load factor is 59% in both years. The plot shows Lesotho's maximum demand pattern over the winter months June-July (31st July 2015, 28th July 2016) with minimums over the November-February period.
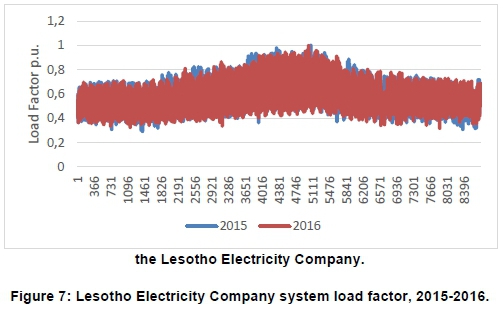
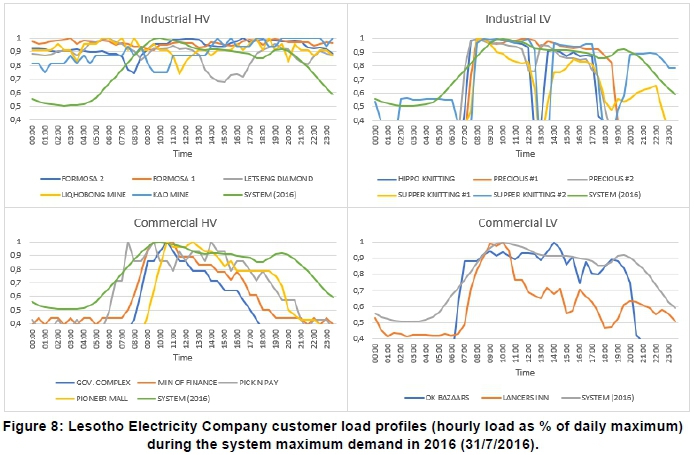
Figure 8 shows the daily load profile for the major customers in each category: industrial HV (five customers), industrial LV (five customers), commercial HV (four customers) and commercial LV (two customers) against the system peak profile in 2016. The profile is depicted as the proportion of the hourly load to the maximum demand for the day. The plots show that in 2016 the peak load occurred at 10:00 am and, on the whole, the peak load for industrial HV customers (05:00 am) tended not to coincide with the system peak (10:00 am), whereas for other customers a coincidence with the peak did occur.
2.3 Diversity of consumption
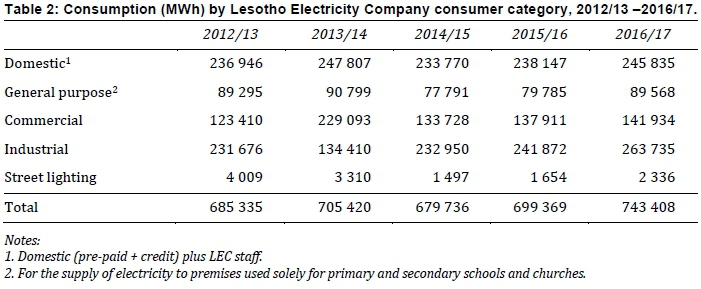
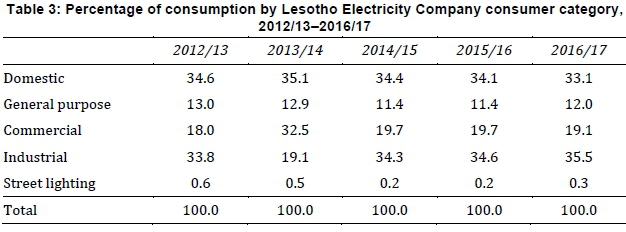
Table 2 shows the diversity of consumption by consumer category, with percentage diversity shown in Table 3. The tables show that consumption is quite diverse, although domestic and industrial make up the main share. Overall, the consumption of each category relative to the total is uniform from year to year.
3. Demand forecast methodology
3.1 MAED Model
The revised and projected electricity demand in this study are carried out using the International Atomic Energy Agency Model for Analysis of Energy Demand (MAED). MAED uses analytical bottom-up variables together with their constituents and their drivers. Its inputs include the gross domestic product (GDP), population, electrification rates, and energy usage per economic sector. The identified major shortcoming of the current NEMP forecast (discussed earlier in the Introduction), namely constant or increasing average household consumption, is addressed in this model. The MAED model forecasts medium-to-long-term energy demand based on the following parameters: socio-economy, technology, and demography.
The model presents a framework for evaluating the impact on energy demand by changes in the overall macroeconomic picture of the country as well as in the standard of living of the population. The energy demand is disaggregated into various end-use categories and each category is affected by assumptions on a number of variables, such as demography (urban/rural population, population growth rate, potential/active labour force), GDP (total GDP and GDP structure by main economic sectors), energy intensities for industry (agriculture, construction, manufacturing and mining), modes of transportation (freight/passenger, in-tra/inter-city), and household usages (space heating/cooling, cooking, water heating and appliances). The total energy demand is combined into the following energy consumer sectors: industry (includes agriculture, construction, mining and manufacturing); transportation; service; and household.
The first year of the model projection, the base year, is typically calibrated to outturn data. This requires collection, verification, and, in the case of Lesotho, estimation (due to scarcity of data) of certain model input data. Once the base year has been calibrated, then scenarios for the future evolution of the system can be computed. The scenarios are typically based on expectations about the overall mac-roeconomic picture but there is scope to focus on more-detailed factors such as consumption efficiency and the penetration of different energy sources in the supply mix (e.g., biomass, solar, fuel, and thermal). The affordability of these energy sources is not taken into consideration.
The model computes total energy demand and there are options for how different types of end-use demand are met. For example, biomass and electricity compete for cooking purposes. The model derives the end-user demand, in terms of useful energy, and then converts useful energy into final energy where penetration and efficiency of all energy sources, including electricity, are taken into consideration.
Excerpts from the input assumption table in MAED for this paper are provided in the supplementary file. These assumptions include Lesotho-specific information where available and, in the absence of such information, values from similar countries and/or the default values of MAED have been utilised. For this work, the output of interest is electricity demand only; however, MAED can also produce total energy demand for all sectors. The MAED model was set-up to produce results for 2010, 2015, 2020, 2025 and 2030, with linear interpolation between the intervening years. Each modelled year was broken down into three periods of four months during which climatic patterns in Lesotho are reasonably constant, namely January-April, May-August, and September-December. The year is then broken down into 53 weeks (the first or last week of the year is normally not a complete week but has been included in the model). Further calendar definitions for days are that the first day of the week is Monday and that there are two types of days - working day and Saturday-Sunday-holiday.
LEC 2010/11 data is used as the 2010 base year data. This allows enough overlap of the actual data with the forecast data to check the validity of the model computations. When comparing consumption between the actual data for consumption (Figure 1) and the forecasted values, the LEC customers are classified as consumers in MAED as follows:
• Household - represents consumption from LEC Special Domestic and Pre-paid Domestic customers.
• Industrial - represents consumption from LEC Industrial customers.
• Service - represents consumption from LEC. Commercial, Special General Purpose and Prepaid General Purpose and Street Lighting customers.
• Transport - not used.
To establish the accuracy of the model, relative error (%) based on the root mean square percentage error (RMSPE) and the mean absolute percentage error (MAPE) are used. RMSPE is calculated as:
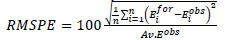
where Eiobsrepresents the ithvalue of the observed/actual electricity demand; Av.Eobsis the average of the observed incidents; and Eiforis the ith value of the forecast electricity demand.
The other performance assessment metric, the mean absolute percentage error (MAPE) is given as:
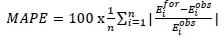
The meaning of the variables is as in RMSPE.
An error below 10% implies an excellent performance of the model. If the value lies between 10% and 20% then the model can be considered to be good. A value above 20% but lower than 30% is still acceptable but not desirable, and anything beyond that is considered a failure of the model to make predictions (Al-Musaylh et al., 2018).
3.2 Model assumptions
The MAED model allows for electrification rates to be defined separately for urban and rural dwellings. The current rate of new connections being undertaken by LEC has already reached the 2020 target of 40% electrification as the current rate is 41% (LEWA, 2018). Our analysis suggests that this level of electrification would involve a reasonable number of rural households that are typically low-level consumers and are also widely scattered. Connecting these customers would perpetuate the declining average consumption per household (Figure 2). Such an approach to electrification would therefore result in marginal increases in overall on-grid consumption and peak demand, unless there is significantly higher growth in the services and industrial sectors.
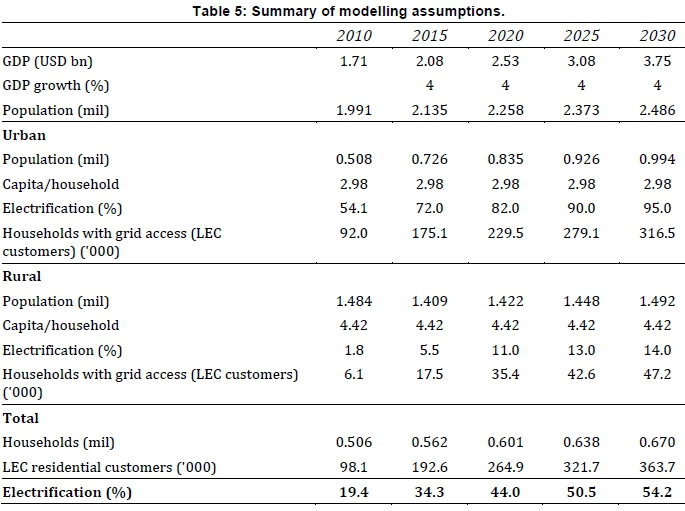
The 2016 population census by the Bureau of Statistics revealed a trend of population urbanisation over the last ten years (Bureau of Statistics, 2016). More precisely, the percentage distribution of household population according to residence location has changed from 24% urban and 76% rural in 2006 to 34% urban, 8% peri-urban and 58% rural in 2016. The modelling therefore adopted grid access for 82% of urban households by 2020, with less significant increases in rural grid access thereafter. The model also adopted a distribution of households of 34% urban in 2020, rising to 40% by 2030. Using this data, it is determined in the model that Lesotho will achieve total household electrification rates of 44% in 2020, 50% in 2025 and 54% in 2030.
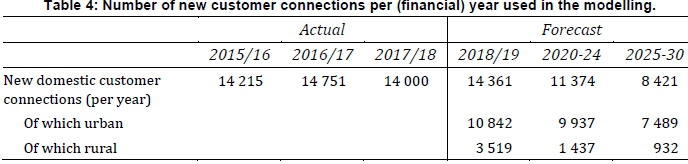
The total number of new connections per year is expected to continue at the recent rate of around 15 000 until 2020. Of this total, 10 000 new connections for households are assumed in urban and periurban areas, while 4 000 is assumed for rural areas. These rural connections will not be funded by LEC, but rather via government funds or universal access funds. This split broadly reflects evidence from LEC that a high portion (around 8-10 thousand) of new connections are from applicants in urban areas. Noting again the decline in average consumption per domestic customer (Figure 2), this suggests that consumption from urban as well as rural households is in decline. This decline would imply there is little economic justification for continuing at this rate; therefore after 2020 the number of new connections is scaled back - see Table 4. Note that the model uses actual numbers for the number of new residential connections added by LEC in the 2015/16 and 2016/17 financial years and assumes new committed connections of 14 000 for 2017/18 based on unpublished expansion plan. The actual population figure for 2006 (Bureau of Statistics, 2006), together with the anticipated percentage growth rate from the United Nations World Population Review (United Nations, 2019), are applied.
GDP growth rate used in the model is the average long-run growth rate of 19 years (2000-2018). This is made up of actual values for 2000 to 2014 and the Central Bank of Lesotho (CBL) projections for 2015-2018 (CBL, 2016). The CBL Economic outlook 2015-2018 indicates that Lesotho's economic growth is estimated to be 3.5% in 2016, 4.3% in 2017 and 4.2% in 2018 (4% is applied in the MAED model). This improvement in economic activities is expected to be supported by the following:
• Strong growth in the diamond mining industry as a result of the beginning of production processes (in the fourth quarter of 2016) at Liqho-bong mine and the achievement of full production capacity at Letseng and Kao mines.
• Positive growth prospects in the building and construction sector, mainly due to the advancement in infrastructure development (including construction of the road to Polihali Dam and accommodation facilities, as well as provision of power supply and telecommunication services) during the implementation of the second phase of the Lesotho Highlands Water Project. Again, the system expansion model includes the associated network upgrades.
• Good performance of the electricity and water sector following the establishment of the Lesotho Energy Policy and the completion of the Metolong Dam project.
A summary of the key modelling assumptions is shown in Table 5.
It is important to note that the MAED model is employed to provide a very broad-brush estimate of electricity demand. The key focus in this analysis has been the proper representation of the decreasing average household consumption. A fuller analysis would have considered the impact of, for example, improvements in consumption efficiency on electrical demand.
3.3 Model calibrations
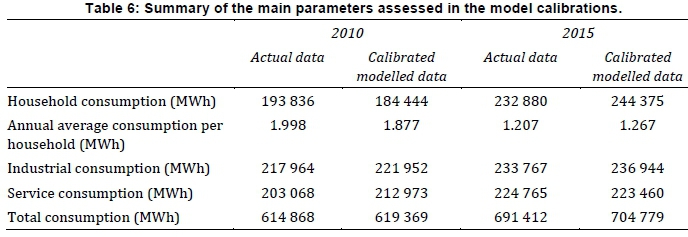
The calibration was applied to the 2010 and 2015 model years using the actual data. To calibrate the overall peak demand and energy consumption by sector (households, industrial and commercial) for 2010 and 2015 presented in Figure 1, the energy intensities of each sector were adjusted until the consumption for each sector was similar to the actual data. For example, in order to accurately forecast electricity consumption for households, adjustments were made to the levels of electricity penetration in both cooking and space-heating for both 2010 and 2015. This followed the observed trend of declining average consumption per household which also addressed the shortcoming of the NEMP forecast. The declining household consumption was extrapolated to subsequent years. Thus, the average electricity consumption per household for 2010 and 2015 was aligned with the historic data as shown in Figure 2. This was achieved by setting the electricity penetration into space-heating for urban dwellings to 0.31% in 2010 and 0.21% in 2015. Furthermore, the electricity penetration levels into cooking for urban dwellings were assumed to be 37.8% in 2010 and 30.7% in 2015. Inputs pertaining to the energy intensities of the service and industrial sectors for 2010 and 2015 were set to result in values for electricity consumption that are closer to the actual. These intensities were then extrapolated to subsequent years. The summary of the calibration results is given in Table 6.
4. Demand profile forecast
MAED is used to forecast the total electrical energy consumption. The corresponding gross system demand projections are derived from these figures.
4.1 Losses
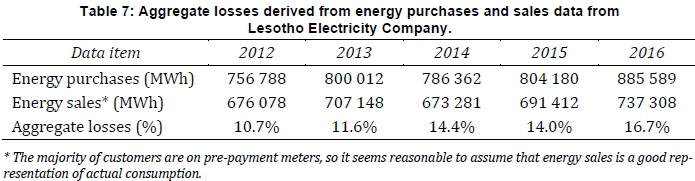
LEC buys all the electricity it supplies. The analysis of energy purchases and final consumption data provided by LEC indicates that aggregate transmission and distribution losses have been around 14%, with an increasing trend in recent years (Table 7). In this study, the final consumption figures produced by MAED are grossed to provide total system gross energy demand by applying a 14.4% loss factor, which is broadly in line with historic trends (Table 7) and expected loss levels for the system going forward.
4.2 Profiling demand
Using the actual 30-minute interval chronological system load data for 2015 provided by LEC, the total gross energy demand can be transformed into an hourly load profile. The hourly load is the average of each half-hourly load within the hour. The per-unit load in each hour is the ratio of the load to the average load across the 8 760 hourly loads in one year:
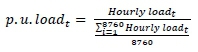
This profile is shown in Figure 9.
The maximum per-unit load coefficient is multiplied by the average system load (final consumption adjusted for losses) to determine the gross peak demand. Based on the 2015 load profile data this is 1.68 and is indicated in Figure 9. It is given by:
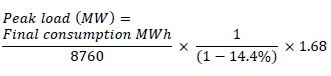
4.3 System peak load
This approach assumes that the evolution of peak demand is driven by the same underlying parameters as final consumption and, for example, there are no measures in place to reduce peak demand growth relative to the overall energy demand growth. For instance, the system operator might procure services to provide demand-side response at times of high system load in order to reduce overall production costs.
4.4 Forecast scenarios
The forecast is made on three possible scenarios for the evolution of on-grid final energy consumption to 2030. The most likely scenario has the recent rate of about 15 000 new connections per year maintained until 2020 and then scaled back from 2020 onwards. The resulting total household electrification rates for the on-grid households are 44% in 2020, 51% in 2025 and 54% in 2030. This scenario assumes the continuation of the current average economic growth rate in all sectors of the economy, with no changes (e.g. national policies) that may affect this trend. Hence, this scenario assumes the continuation of the long-term average GDP growth rate of 4%.
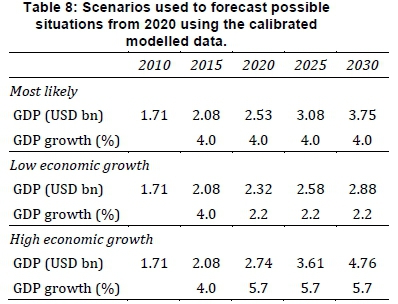
The analysis considers two alternative scenarios for GDP growth. The low economic growth scenario defines a lower bound for economic development. The average GDP growth rate of the lowest five years in the last 19 years (2000-to 2018), 2.19%, is used. Low growth might occur for a number of reasons, such as unstable socio-economic and political environments, and low levels of internal and foreign investment. The high economic growth scenario assumes an economic growth rate of 5.68%, which is the average GDP growth rate of the highest five years in the last 19 years. This scenario is expected to influence factors that result in higher energy consumption, even for households, hence the levels of electricity usage intensities in both cooking and space heating are adjusted upwards. The scenarios are summarised in Table 8. They are used to forecast possible situations from 2020 using the calibrated modelled data for 2010 and 2015.
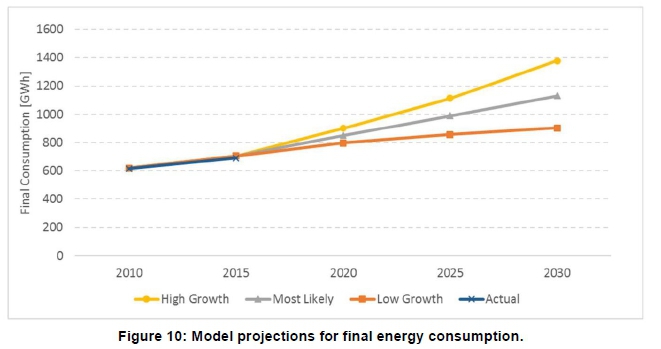
4.5 Forecasts
In all scenarios, demand is expected to rise. Figure 10 shows energy consumption. Average household consumption falls in all scenarios, as seen in Figure 11. With the most likely scenario, the peak demand is expected to increase from 154.2 MW in 2015 to 211 MW in 2030, while average household consumption will fall from 1 205 kWh/customer/year in 2015 to 1 009 kWh/year in 2030.
The steep decline in average consumption per household experienced since 2000 is reduced to a more gradual decrease from around 2015 in the model. This levelling off in the decline in consumption is the result of the modelled reduction in electrification explained in Section 3.2.
Should Lesotho realise a high economic growth, both the peak and average consumption are expected to rise further to 258 MW and 1 218 kWh/customer/year by 2030, respectively. Table 9 gives the summary of the forecast results.
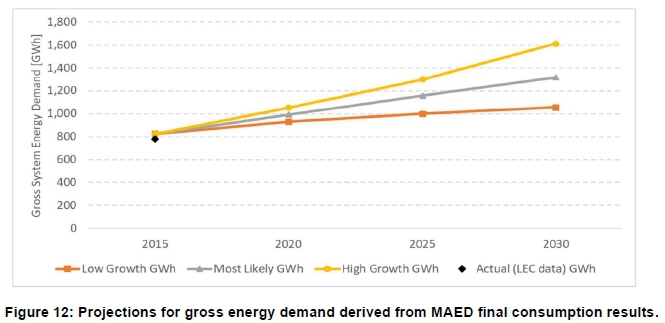
4.6 Gross system energy demand
Figure 12 shows the total gross energy demand for the three scenarios relative to the final consumption.
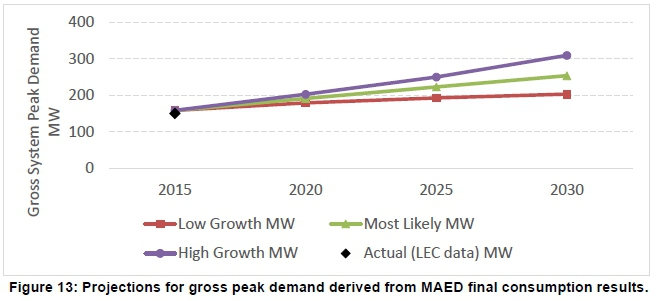
4.7 System peak load
Figure 13 shows the total gross system maximum demand for the three scenarios relative to the final consumption.
5. Conclusion
The most likely scenario for on-grid final energy consumption represents the total household on-grid electrification rates of 44% in 2020, 50% in 2025, and 54% in 2030. In all scenarios, despite the average consumption per household reducing and a reduction in the rate of new connections, the overall residential demand is expected to increase. However, the continually declining average household consumption, which currently is already below the level that ensures good health and adequate participation in society, is cause for concern. Hence there is an urgent need to look into policy change around reducing the costly grid extension to poor remote areas as an intervention but rather looking into relevant affordable solutions, such as localised mini-grids.
To validate the forecast accuracy of the model, statistical error metrics were employed. Over the period 2010 to 2015, where the actual data is available for comparison, the model produced results with RMSPE of 2.4% for industrial consumption, 4.9% for household consumption, and 1.5% for total energy consumption. In the same period, MAPE was also used to complement the RMSPE. Its results were 2.3% for industry, 4.89% for household consumption, and 1.33% for total consumption. The error metrics give very favourable results, hence confidence in the accuracy of the projections (Aman et al., 2011; Elamin and Fukushige, 2018; Ramanathan et al., 1997; Soares and Souza, 2006; Yukseltan et al., 2017).
Although MAED, as a bottom-up framework, captures most features of a developing country, it is not without limitations, the greatest being its inability to analyse priced policies. The extent to which a price of a commodity influences its consumption and that of other commodities is not adequately addressed. Employing an energy demand forecasting that has both the capabilities of econometric and end-use models could be used in the future and the results compared to those obtained in this study.
The medium-to-long-term development plans for Lesotho to meet the projected demand from the supply side include exploration of 87.93 MW of hydro power, while solar and wind are 290 MW and 432.7 MW of generation potential respectively (MEM, 2017). The same demand could be met via imports from the Southern Africa Power Pool (SAPP) region, which indicates sufficient generation capacity for the projected period. Be that as it may, the generation-related policies should look into the associated import costs and security of supply (SAPP, 2016).
As embedded in the national energy policy, objectives that this paper help address include, but are not limited to, the planned adequate security of power supply, by providing the basis upon which generation plans will be grafted. The second policy objective is that of enhancing the participation of private sector in the electricity supply industry, and this paper provides quantifiable figures of projected demand that will serve as the corroboration around which business and investment plans will be drawn (MEM, 2015).
Author contributions
M. Mpholo: Writing original draft, supervision. M. Mothala: Investigation, Writing - review and editing.
L. Mohasoa: Data curation.
D. Eager: Methodology, formal analysis, validation.
R. Thamae: Conceptualisation, w riting - review and editing.
T. Molapo: Resources.
T. Jardine: Funding acquisition, project administration.
Acknowledgements
This work is the result of a sanctioned study for Lesotho Electricity and Water Authority undertaken by the authors, financially supported by the African Development Bank, so thanks are due to the two institutions. Lesotho Electricity Company is thanked for providing the data and for constructive discussions. Moeketsi Mpholo and Matsoso Mothala thank Prof. Haim Bau and the National Science Foundation, through the University of Pennsylvania Materials Research Science and Engineering Center DMR-1720530, for support in the writing of this paper.
References
Adeoye, O. and Spataru, C. 2019. Modelling and forecasting hourly electricity demand in West African countries. Applied Energy 242: 311-333. [ Links ]
Al-Musaylh, M.S., Deo, R.C., Adamowski, J.F. and Li, Y. 2018. Short-term electricity demand forecasting with MARS, SVR and ARIMA models using aggregated demand data in Queensland, Australia. Advanced Engineering Informatics 35: 1-16. [ Links ]
Aman, S., Ping, H.W. and Mubin, M. 2011. Modelling and forecasting electricity consumption of Malaysian large steel mills. Scientific Research and Essays 6. [ Links ]
Bhattacharyya, S.C. and Timilsina, G.R. 2010a. Modelling energy demand of developing countries: Are the specific features adequately captured? Energy Policy 38: 1979-1990. [ Links ]
Bhattacharyya, S.C. and Timilsina, G.R. 2010b. A review of energy system models. International Journal of Energy Sector Management 4: 494-518. [ Links ]
Bhattacharyya, S.C. and Timilsina, G.R. 2009. Energy demand models for policy formulation: A comparative study of energy demand models (Working paper No. 4866), Policy Research. The World Bank. [ Links ]
Bureau of Statistics. 2016. Census summary: key findings. 2016. Bureau of Statistic, Maseru, Lesotho. CBL [Central Bank of Lestho]. 2016. Lesotho Economic Outlook 2015 - 2018, Central Bank of Lesotho, Maseru, Lesotho. [ Links ]
Elamin, N. and Fukushige, M. 2018. Modeling and forecasting hourly electricity demand by SARIMAX with interactions. Energy 165: 257-268. [ Links ]
Government of Lesotho. 2007. National Electrification Master Plan (No. 64131- 0-13). Government of Lesotho, Maseru, Lesotho. [ Links ]
Hainoun, A., Seif-Eldin, M.K. and Almoustafa, S. 2006. Analysis of the Syrian long-term energy and electricity demand projection using the end-use methodology. Energy Policy 34: 1958-1970. [ Links ]
Kichnoge, B., John, G.R., Mkilaha, I.S.N. and Hameer, S. 2014. Modelling of Future Energy Demand for Tanzania. Journal of Energy Technologies and Policy 4: 16-31. [ Links ]
LEWA [Lesotho Electricity and Water Authority]. 2017. Lesotho Electricity and Water Authority - Annual report 2016/17. LesothoElectricity and Water Authority, Maseru, Lesotho. [ Links ]
LEWA [Lesotho Electricity and Water Authority]. 2018. Electricity Supply Cost of Service Study Report. Lesotho Electricity and Water Authority (LEWA), Maseru, Lesotho. [ Links ]
MEM [Ministry of Energy and Meteorology]. 2015. Lesotho Energy Policy 2015 - 2025. Ministry of Energy and Meteorology , Maseru, Lesotho [ Links ]
MEM [Ministry of Energy and Meteorology], 2017. Scaling-up renewable energy in low income countries - investment plan for Lesotho. Ministry of Energy and Meteorology, Maseru, Lesotho [ Links ]
Minnaar, U.J., Visser, W. and Crafford, J. 2017. An economic model for the cost of electricity service interruption in South Africa. Utilities Policy 48: 41-50. [ Links ]
Mpholo, M., Mothala, M., Mohasoa, L., Eager, D., Thamae, R., Molapo, T. and Jardine, T., 2020. Determination of the life-line electricity tariff for Lesotho. Energy Policy 140 [ Links ]
Ramanathan, R., Engle, R., Granger, C.W.J., Vahid-Araghi, F. and Brace, C., 1997. Short-run forecasts of electricity loads and peaks. International Journal of Forecasting 13: 161-174. [ Links ]
SAPP [Southern African Power Pool]. 2016. Southern African Power Pool - Annual Report 2016. Southern African Power Pool, Harare, Zimbabwe [ Links ]
Senatla, M., Nchake, M., Taele, B.M. and Hapazari, I. 2018. Electricity capacity expansion plan for Lesotho - implications on energy policy. Energy Policy 120: 622-634. [ Links ]
Soares, L.J. and Souza, L.R. 2006. Forecasting electricity demand using generalized long memory. International Journal of Forecasting 22: 17-28. [ Links ]
Steinbuks, J. 2019. Assessing the accuracy of electricity production forecasts in developing countries. International Journal of Forecasting 35: 1175-1185. [ Links ]
Suganthi, L., Samuel, A.A., 2012. Energy models for demand forecasting-A review. Renewable and Sustainable Energy Reviews 16: 1223-1240. [ Links ]
TimesLive, 2019. Electricity prices to rise 9.4% this year, 8.1% next year. Available at https://www.timeslive.co.za/news/south-africa/2019-03-07-electricity-prices-to-rise/ (Accessed: 4 July 2019). [ Links ]
United Nations. 2019. Lesotho Population 2019 (Live). Available at: https://worldpopulationreview.com/countries/lesotho-population (Accessed: 27 July 2019) [ Links ]
Yukseltan, E., Yucekaya, A. and Bilge, A.H., 2017. Forecasting electricity demand for Turkey: Modeling periodic variations and demand segregation. Applied Energy 193: 287-296. [ Links ]
* Corresponding author: Energy Research Centre, National University of Lesotho, Roma 180, Lesotho; email: moeketsi@seas.upenn.edu
