


Services on Demand
Journal

Article
 English (pdf)
 Article in xml format
 Article references
 Send this article by e-mail
Indicators
Related links
-
 Cited by Google
 -
 Similars in Google
Share

 Permalink
Journal of Energy in Southern Africa
On-line version ISSN 2413-3051Print version ISSN 1021-447X
J. energy South. Afr. vol.26 n.4 Cape Town Nov. 2015
Batteryless PV desalination system for rural areas: A case study
Ali M AlmaktoofI, *; Atanda K RajiI; Mohammed T E KahnI; Mohamed Ali EkhlatII
IDepartment of Electrical, Electronic and Computer Engineering, Cape Peninsula University of Technology, Bellville Campus, South Africa
IIDepartment of Electrical and Electronic Engineering, University of Tripoli, Tripoli, Libya
ABSTRACT
The use of photovoltaics (PVs) to power reverse osmosis (RO) desalination can potentially break the dependence of this desalination process on conventional energy sources (oil, coal, electricity from national grid), reduce operational costs, and improve environmental sustainability. In this paper, a methodology for the optimal sizing and performance evaluation of a stand-alone PV system to power an RO desalination unit is presented. This unit covers the water needs of inhabitants of a small isolated village called Mrair-Gabis, near the Ajdabiya city in north-eastern Libya. A photovoltaic-reverse osmosis (PV-RO) system offers good possibilities for satisfying this need. Due to the many technical problems with batteries, as well as their high cost, the system studied in this paper will not consider the use of batteries; the viability of a batterryless system is facilitated by the high solar radiation at the selected site, and long daily average insolation duration. From the water consumption records it was noticed that during some days in summer the water produced by the RO unit does not meet the water demand; on the other hand, during some days of the month there will be an excess of water production. The above considerations led to the design of a freshwater tank, to cover the potable water needs for people in cases of the desalination unit breaking down, either due to tech-nical problems or on the cloudy days. The purpose of the water tank is therefore to store excess water when production exceeds supply. Simulations were carried out using MATLAB Software to size and assess the performance of a stand-alone PV system. The computer program can be applied to any site with different weather conditions.
Keywords: desalination, photovoltaics, PV arrays, reverse osmosis, rural areas
1. Introduction
Libya is located in the middle of North Africa, with 88% of its area considered to be desert. The south is located in the Sahara Desert, where there is a high potential for harvesting solar energy. This energy can be used to generate electricity by both photovoltaic and thermal conversion. Libya was one of the first developing countries in which a PV system was first put to work to supply electricity for a cathodic protection station in 1976. Since then, PV systems have been widely used as stand-alone systems. In the coastal region the daily average of solar radiation on a horizontal plane is 7.1 kWh/m2, and in the southern region it is 8.1 kWh/m2; the average sun duration in Libya is more than 3500 hours per year (Ibrahim et al., 2006). The total peak power installed in Libya developed from less than 20 kWp in the late 1970s, to about 85 MWp by the end of 2013. All systems are stand-alone; and no grid-connected systems have yet been established in Libya (REAoL, 2013). Based on economical and technical reasons, the installation of PV power supply systems for supplying electrical energy to remote and isolated areas is justified.
The coupling of small-capacity reverse osmosis desalination with solar energy is a promising field of development in the desalination sector and being the most common desalination process, with the potential to improve its sustainability by minimizing or completely eliminating the dependence on fossil fuels (Carvalho et al., 2013; Davis, 2013; Mathioulakis et al., 2007). The attractiveness of a PV system lies particularly in its high reliability and relative ease of installation. PV-RO systems provide a potential solution for providing freshwater to small communities in isolated arid areas having the following problems: 1) saline water; 2) no access to the electricity grid, and; 3) abundant solar resources. PV-RO systems have a minimal environmental impact, are easily designed and assembled for different demand profiles by using modular components (Carvalho et al., 2013), and are easily maintained and repaired.
This paper presents a simplified method for sizing and performance analysis of a stand-alone PV system applied to power an RO desalination unit in a rural area. Section 2 of this paper presents an overview of PV-RO desalination. Sizing methodology of the PV system to supply electricity for an RO desalination plant is presented in Section 3, and simulation results and discussion are presented in the penultimate section. In the last section of the paper, conclusions are presented.
2. An overview of reverse osmosis desalination powered by photovoltaics
PV-powered RO systems have been implemented in different regions, e.g.: remote areas of the Libyan dessert, isolated areas of Jordan, and outlying areas in Australia. When considering commercial photo-voltaics for connection to an RO system, PV-powered desalination has previously been regarded as not being a cost-competitive solution when compared with conventionally powered desalination. However, the decline in PV costs over the last few years has changed this outlook. The distance to the national electric grid at which PV energy is competitive with conventional energy depends on the RO plant capacity, and on the salt concentration of the feed (Carvalho et al., 2013; Davis, 2013; Fthenakis et al., 2015; Shatat et al., 2013).
Numerous renewable-energy-powered RO plants, primarily driven by PV systems of small to medium capacity (0.5 to 50 m3/day), have been built in different locations of the world. For example, a small PV-driven reverse osmosis desalination plant with an average daily drinking water production of 0.8-3 m3/day, was constructed on the island of Gran Canaria (Banat et al., 2012). In Saudi Arabia, a PV-RO brackish water desalination plant was installed (Fthenakis et al., 2015; Hasnain & Alajlan, 1998), and it was connected to a solar still with a delivery capacity of 5 m3/d. The feed water for the still was the blowdown from the RO unit (10 m3/d). Riffel & Carvalho (2009) presented the concept of a small-scale batteryless PV-RO desalination plant for stand-alone applications, specifically for treating brackish water in equatorial areas. This plant is capable of operating under varying flow and pressure conditions. Another example is a PV-RO desalination plant, for supplying a village, built in southern Tunisia. This plant uses solar energy to power a reverse osmosis brackish water desalination unit and has a capacity of 15m3/day. Bourouni & Chaib (2009) presented an analytical description of the components of this Tunisian plant and reported experimental results for a 6-month operating period. Several problems were highlighted, such as brine rejection, low efficiencies, and high cost.
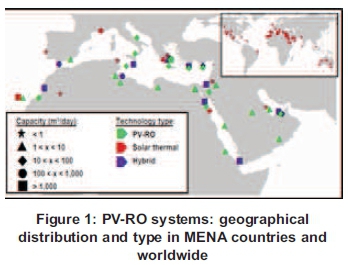
Most of the research was conducted in regions or countries where the conditions for solar-driven desalination are the most favourable, i.e., intense solar radiation and severe water scarcity. These include the Middle East and North African (MENA) region (Fthenakis et al., 2015; Ghermandi & Messalem, 2009), the southernmost part of Europe, and Australia. The global spread of these desalination plants is shown in Figure 1, and they are all sited in areas where the yearly average solar irradiance on a horizontal surface is significantly higher than the worldwide average (Bourouni, 2012). RO has been found to be the technology most often used in these regions. When considering all the desalination plants installed throughout the world, it has been established that reverse osmosis accounts for the highest production, namely 43.5% of world production (Bourouni, 2012).
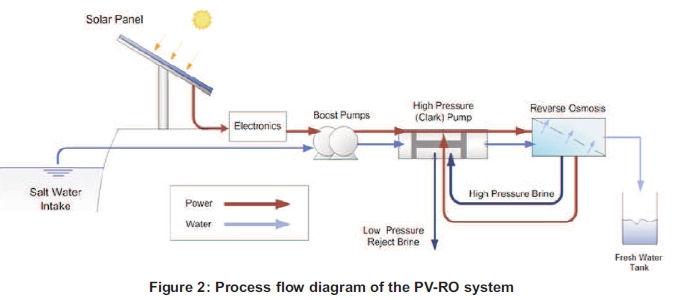
A PV-RO system consists of a solar panel, an inverter, an RO desalination plant and a storage tank (Almaktoof et al. 2012). The process flow diagram of the PV-RO system is shown in Figure 2.
3. Sizing methodology of a PV-RO system
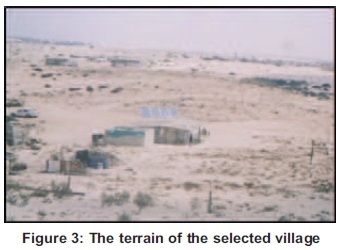
Mrair-Gabis, which has no electric power supply from the national grid, was selected for the case study. The village is located about 50 km southwest of Ajdabiya a city in north-eastern Libya. It has a latitude and longitude of 30.72°N, 19.8645°E respectively. The climate in this selected region is the Mediterranean and the ambient temperature ranges between -5°C and 45°C. The population of the village was counted as 39 families, totalling of 150 inhabitants, scattered over an area of about 15 km2. The villagers live either in houses, or in huts, and there is a school catering for the scholars from the first to the ninth grade. Figure 3 shows the terrain of the village.
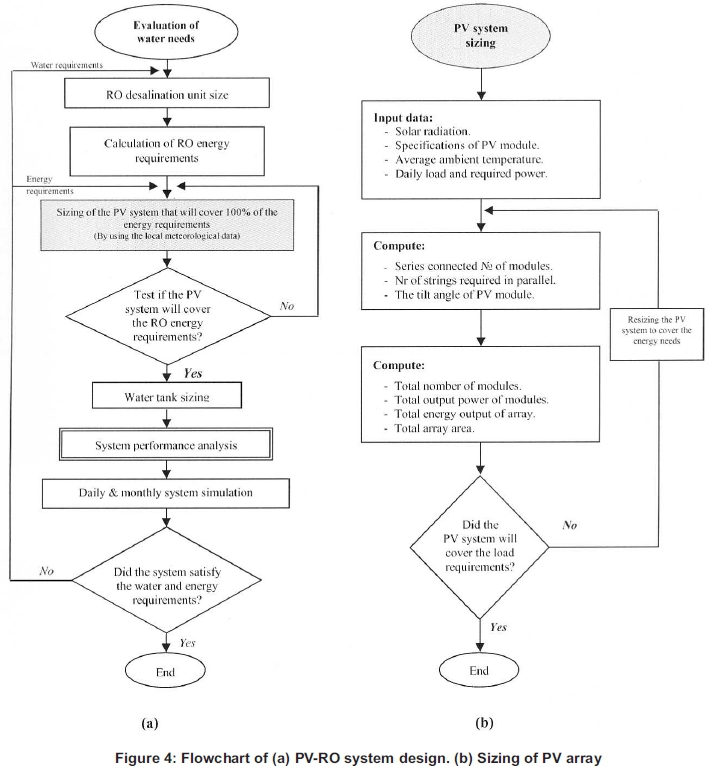
The steps for sizing a PV system to power an RO desalination plant are executed by a computer program. This program was written in MATLAB software. Figure 4 shows the sequence of the sizing methodology applied for determining the capacity of an RO desalination plant driven by a PV system. The total daily energy requirements for the RO unit, softener unit and the auxiliaries (sensors, data acquisition system etc.) were determined as follows:
3.1 RO desalination unit sizing
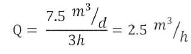
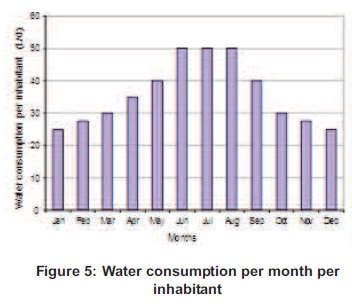
The departure point is evaluating the water needs of the selected village consisting of about 150 inhabitants. The maximum daily water requirement f the 150 villagers was estimated on the assumption that each person consumes 0,05 m3 per day; and this consumption figure takes account of future water needs as well. The maximum total water requirement of the village is therefore 7.5 m3 per day. Figure 5 shows the assumed monthly water consumption distribution. The minimum daily operation time of the system is taken as 3 hours. This assumption is based on the shortest sunshine days during the year. The water flow rate needed from the RO unit (Q) can then be calculated as follows:
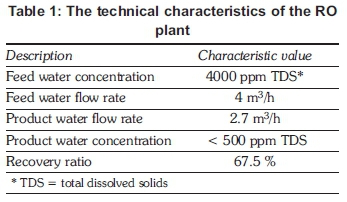
This flow of processed water covers the daily needs of the population in this village. The technical characteristics of the RO plant are shown in Table 1.
3.2 Energy needs of RO unit
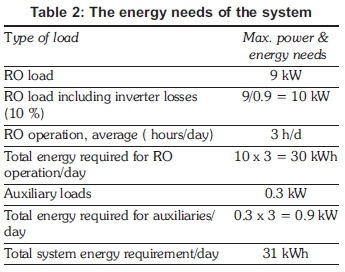
The total daily energy requirements for the RO unit, softener unit and the auxiliaries (sensors, inverter losses Auxiliary loads etc.) have been summarized in Table 2
3.3 PV system sizing to cover 100% of energy needs
Calculation steps carried out in order to determine the sizing of the PV system are set out in the flow-chart presented in Figure 4b. To avoid the effort of calculating the monthly global irradiation of the PV modules, the monthly best-tilt angle of the modules and the energy needs to be supplied by the PV system, all data such as monthly and daily sunshine duration, and monthly and daily global irradiation, have been collected for processing by MATLAB software.
3.3.1 PV module tilt angle
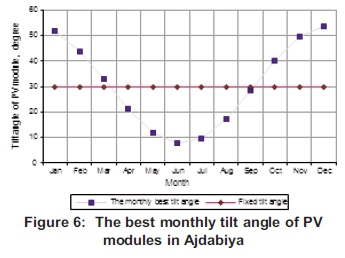
Due to high cost of tracking mechanism systems, most applications of PV systems use a fixed-tilt angle. This fixed-tilt angle is determined using local meteorological data, in order to select the best tilt-angle for maximising total solar radiation collected over a one year period. By using the data from Ajdabiya weather station, the maximum total solar radiation collected over a one year period was determined at fixed-tilt angle was recorded for the selected site;this is shown in Figure 6. In this paper, the best monthly tilt angle was determined by calculating that angle using the following equation:
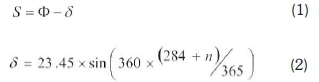
where:
S: tilt angle of PV modules (degrees)
Φ : latitude for the location (degrees) [for the study case (Φ) = 30.5663°]
δ: declination angle (degrees)
n: recommended average day for a month
From the above equations one can calculate the best monthly tilt angle (S) by taking the recommended average day for each month (n). It must be noted that the recommended average day for each month (n) is not valid for a site location with latitude, |Φ|> 66.5° (Almaktoof et al., 2012; Duffie & Beckman, 2013). The monthly tilt angles were calculated using MATLAB software to select the best tilt angles of PV panels;. The results are shown in Figure 6.
It can be seen in Figure 6 the monthly optimum tilt angle varies from the largest angle value (54°) in December to the smallest angle value (8 °) in June when the optimal position of the surface is almost horizontally inclined. For months with the lowest irradiation (January and December), a significant decrease occurs when the panels are not set at calculated optimum monthly tilt angle for the particular month. It is obvious that there are big differences in the optimum monthly tilt angle between the summer and the winter season. Hence, assuming six months each for summer and winter, an optimum tilt angle is calculated for each season, in order to maximize the total irradiation of the surface. From Figure 6 it can be seen that the optimum tilt angle for the summer season is 15° while for winter season it is 50°.
3.3.2 Energy to be delivered by the PV arrays
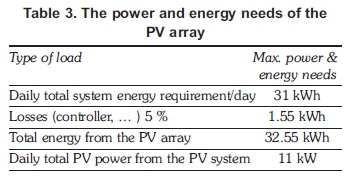
The theoretical daily energy requirement for the system is about 32.55 kWh/day, including the inverter losses. The PV thermal losses (TL) are about 5% (Ahmad & Schmidt, 2002). An initial sizing for the PV arrays is shown in Table 3.
The maximum output power of a PV array can be determined as detailed below.
Calculate the average daily energy output from a PV array, by using Equation 3 (Duffie & Beckman, 2013; Treble, 1991):
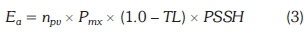
where:
Ea: Array output energy (kWh/day)
npv: Number of PV panels
TL : PV thermal losses
PSSH : Average peak sunshine hours
Pmx: Maximum output power from one PV module (watt)
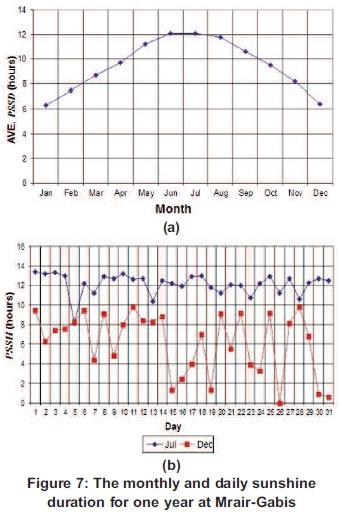
The number of hours for monthly and daily sunshine duration (PSSH) in Mrair-Gabis is shown in Figure 7. The maximum output power, Pmx can be calculated by using Equation 4:

where:
Pm: Maximum power under standard condition (watt)
a: Temperature coefficient of power (per °C)
Ta : The average ambient temperature (°C)
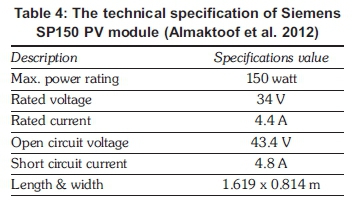
The number of panels required was calculated as 74 (2 arrays in series with each array consisting of 37 panels in parallel\. The land area required for these PV panels depends on the panel tilt angle, the height of the structure, and the latitude of the region. The land area required was calculated to be 100m2. Siemens SP150 PV modules were selected for this project. The technical specification of this module is shown in Table 4.
Figures 8a and b show the monthly and daily global irradiation respectively, of the array panels at Mrair-Gabis. This global irradiation was calculated for the selected site from data collected by a weather station at Ajdabiya, and obtained from the Center of Solar Energy Studies (CSES) and the General Electricity Company of Libya (GECOL) (GECOL, 2004; 2008). The average monthly data was taken from the years 1997 to 2007 (Almaktoof, 2009).


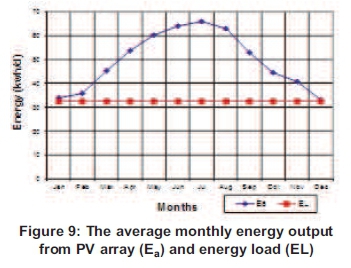
Figure 9 shows the average monthly energy output from the PV array (Ea) and energy load (EL).
3.3.3 Water tank capacity
The tank size depends on the required fresh water autonomy days of the system with zero energy production, the maximum excess water production during the day, and a safety volume of water at the bottom of the tank below which no water can be discharged from the tank. The fresh water autonomy days was set at three summer days (22.5 m3). The maximum excess water produced in one summer day was calculated from the difference between water production and water consumption, and finally the safety volume was assumed to be 10% of the water tank volume. Taking the above considerations into account, the water tank volume was calculated to be as follows:
volume = 22.5 + 2.25 = 24.25m3 ≈25m3
4. Results and discussion
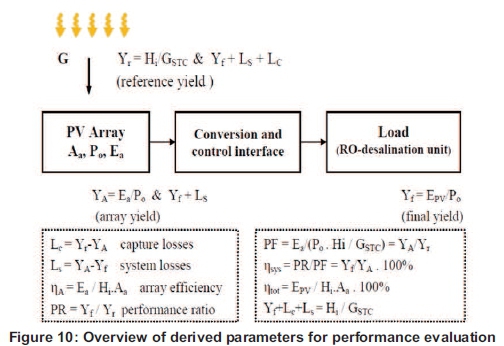
A PV-RO system has been programmed with MAT-LAB, in order to size a PV system to supply the RO desalination plant, and a MATLAB/Simulink model of the system was created to simulate the behaviour of the system. The quantities used to assess the performance of a stand-alone PV-RO system are shown in Figure 10 (Clavadetscher, 1995; Dahl, 2000; Mayer & Heidenreich, 2003).
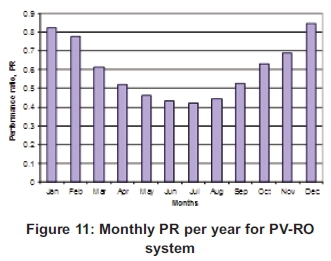
A bar graph in Figure 11 shows the monthly performance ratio (PR) of the PV-RO system over a year. It can be seen in Figure 12 that the monthly mean values of PR can directly be compared for each month per year. The annual mean value of the monthly PR is 0.599.
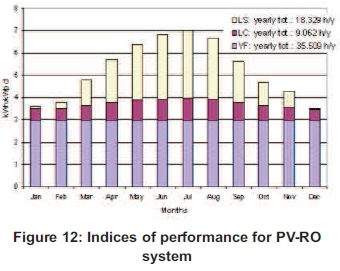
The bar graph in Figure 12 shows monthly final yields (Yf), system losses (Ls) and array capture losses (Lc) stacked for each month and expressed in kWh/kWp.day. The annual yields and losses are calculated as Yfis 35.5 h/y, Lsis 18.3 h/y and Lcis 9 h/y.
Figure 13 clearly shows the relationship between the array yield, YA and reference yield, Yr because, by definition, Ya= Yf+ Lsand Yr = Yf+ Ls+ Lc. The performance ratio, being the ratio of the final yield to the performance yield, is the most useful normalized performance indicator. For an array it indicates the overall effect of losses of nominal energy output due to array temperature, incomplete utilisation of irradiation, and system component inefficiencies and failures.

Figure 13 shows the annual values of the reference yield and the final yield for a stand-alone system. The mean value of the reference yield is 5.242 h/day and for final yield 2.959 h/day giving an average PR of 0.6 (see Figure 12).
To calculate the efficiency a new coefficient, the production factor (PF) is introduced. Figure 14 shows the average PF the PR of the system, and the efficiency of the system (nsys). Analysis of the system efficiency as presented in Figure 14, leads to the following results:

1. PR and PF are indications on the system operation.
2. The system efficiency of most PV-RO systems is in the range 70% to 98%.
3. The system identified by red squares has high PF values and efficiencies, but PR lower than 70%, caused by technical problems.
5. Conclusions
In this paper, a methodology for the optimal sizing and evaluation of a desalination unit, powered by a PV energy source, suitable for a rural village, has been presented. It was found that the application of a PV system plays an important role in the development of rural villages and PV systems for supplying electrical energy to remote areas are justified, based on economic and technical reasons. Due to the sparsely distributed population in Libya, the provision of renewable energy as an alternative source of energy is recommended. Small scale PV-RO desalination units represent a possible alterna-tive to potable water supply for rural areas, where there is no access to the electricity grid. The performance of the system depends on the technology selected for the desalination unit components. The system efficiency of a PV-RO system is in the range 70% to 98%. The computer program which was used in this study can be applied to any site with different weather conditions.
References
Ahmad G. & Schmidt, J., (2002). Feasibility Study of Brackish Water Desalination in the Egyptian Deserts and rural Regions Using PV Systems, Energy Conversion and Management, 43(18): 2641-2649. [ Links ]
Almaktoof, A. M. A., (2009). Sizing, Evaluation and Economic analysis of a Stand-alone PV System to power a desalination unit for Rural Areas", M.Sc. Thesis, EE Dep., University of Tripoli, Tripoli, Libya, 2009. [ Links ]
Almaktoof, A. M., Shebani, N. M., Ekhlat M. A., & Edweeb, M. M., (2012). Economical Analysis of a Stand-Alone PV-RO Systems for Rural Areas, Zaytoonah University International Engineering Conference on Design and Innovation in Infrastructure 2012 (ZEC Infrastructure 2012), June 18-20, Amman, Jordan. [ Links ]
Banat F, Qiblawey H., & Al-Nasser Q., (2012). Design and Operation of Small-Scale Photovoltaic-Driven Reverse Osmosis (PV-RO) Desalination Plant for Water Supply in Rural Areas Computational Water, Energy, and Environmental Engineering. 1(2012), pp. 31-36 [ Links ]
Bourouni K., (2012). Optimization of Renewable Energy Systems: The Case of Desalination, Modelling and Optimization of Renewable Energy Systems, Dr. Arzu §encan (Ed.), ISBN: 978-953-51-0600-5, InTech, Available from: http://www.intechopen.com/books/modeling-and-optimization-of-renewable-energysystems/optimiza-tion-of-renewable-energy-systems-the-case-of-desali-nation. [ Links ]
Bourouni, K. & Chaibi, M.T., (2009). Solar Energy for Application to Desalination in Tunisia: Description of a Demonstration Project, Chapter 8, Renewable Energy in the Middle East: Enhancing Security through Regional Cooperation, Springer Science, Berlin. [ Links ]
Carvalho PC, Carvalho LA, Hiluy Filho JJ, & Oliveira RS. (2013). Feasibility study of photovoltaic powered reverse osmosis and pumping plant configurations. IET Renewable Power Generation 2013; 7(2): 134-143. [ Links ]
Clavadetscher, L., (1995). First Publication of Swiss data in the IEA database, (Erste Vergleiche der Anlagen-Performance, in German), Proceedings of National PV Seminar, Fribourg, Switzerland, 4-5 April 1995, 103. [ Links ]
Dahl, R., (2000). IEA-PVPS Task 2 Report: Analysis of Photovoltaic Systems, Forschungszentrum Jülich, BEO, Report IEA-PVPS 2-01:2000. [ Links ] [Online] Available at: http://iea-pvps.org/index.php?id=9&eID=dam_frontend_push&docID=194. [Accessed 09 October 2014].
Davis LW., (2013). The economic cost of global fuel subsidies. National Bureau of Economic Research 2013. [ Links ] [Online]. Available: http://www.nber.org/papers/w19736. [Accessed: 30-Jun-2014].
Duffie, J. A. and Beckman, W. A., (2013). Solar Thermal Power Systems, in Solar Engineering of Thermal Processes, Fourth Edition, John Wiley & Sons, Inc., Hoboken, NJ, USA. doi: 10.1002/9781118671603.ch17 [ Links ]
Fthenakis V., Atia A. A., Morin O., Bkayrat R. and Sinha P (2015). New prospects for PV powered water desalination plants: case studies in Saudi Arabia, Prog. Photovolt: Res. Appl., doi:10.1002/pip.2572. [ Links ]
GECOL, General Electric Company of Libya, (2004). Annual Report 2004, Tripoli, Libya. [ Links ]
GECOL, General Electric Company of Libya, (2008). Annual Report 2008, Tripoli, Libya. [ Links ]
Ghermandi A. & Messalem R., (2009). Solar-driven desalination with reverse osmosis: the state of the art, Desalination and Water Treatment, 7 (2009): 285-296. [ Links ]
Hasnain, S.M. & Alajlan, S.A., (1998). Coupling of PV powered RO brackish water desalination plant with solar stills, Desalination, 116: 57-64. [ Links ]
Ibrahim, I. M., Saleh Ekhlat, M. A., & Krema, N. M., (2006). Photovoltaics in Libya application and evaluation, Proceedings of the International Conference on Renewable Energy for Developing Countries-20, 2006, Washington. [ Links ]
Mathioulakis, E., Belessiotis, V., & Delyannis, E. (2007). Desalination by using alternative energy: review and state-of-the-art. Desalination, 203(1-3), 346-365. [ Links ]
Mayer, D., & Heidenreich, M., (2003). Performance Analysis of Stand Alone PV Systems from a Rational use of Energy Point of View, Proceedings of 3rd World Conference on Photovoltaic Energy Conversion (WCPEC-3), 7O-C8-05:2155-2158, 1118 May 2003, Osaka, Japan. [ Links ]
REAoL, (2013). National Plan for developing The Renewable Energy in Libya (2013-2025), Renewable Energy Authority of Libya (REAoL), Ministry of Electricity and Renewable Energy. [ Links ]
Riffel D. & Carvalho, P., (2009). Small-Scale Photovoltaic- Powered Reverse Osmosis Plant without Batteries: Design and Simulation, Desalination, 247(1-3): 378-389. [ Links ]
Shatat M, Worall M, and Riffat S. (2013) Opportunities for solar water desalination worldwide: review. Sustainable Cities and Societies 2013; 9: 67-80. [ Links ]
Treble, F C.,(1991). Generating Electricity from the Sun, 1991, by Pergamon Press plc. [ Links ]
Received 20 January 2015; 17 November 2015
* Corresponding author Tel.: 021 959 6464; alialmaktoof@gmail.com
