


Services on Demand
Journal

Article
 English (pdf)
 Article in xml format
 Article references
 Send this article by e-mail
Indicators
Related links
-
 Cited by Google
 -
 Similars in Google
Share

 Permalink
Journal of the South African Institution of Civil Engineering
On-line version ISSN 2309-8775Print version ISSN 1021-2019
J. S. Afr. Inst. Civ. Eng. vol.61 n.1 Midrand Mar. 2019
https://doi.org/10.17159/2309-8775/2019/v61n1a1
TECHNICAL PAPER
MicroCT-based bulk density measurement method for soils
S G le Roux; A du Plessis; C E Clarke
ABSTRACT
High-resolution micro-computed tomography (microCT) is a method growing rapidly in popularity and has been applied to various soil studies with great success, especially for 3D characterisation of pore spaces or mineral distributions. However, microCT is not typically used for soil bulk density measurements, probably due to relatively simple and fast alternatives. Besides the complex process of image analysis from microCT scans, the method is also limited in resolution, which can result in incorrect total porosity estimation. This is especially true for granular materials, such as soils with small pore spaces between particles. In this work we demonstrate a different, yet very simple methodology for microCT adapted to overcome these limitations by using only volumetric measurements of the samples, and not segmentation of pore spaces or density calibrations. This method allows accurate bulk density determination for soil clods and cores. The method is faster than tradition methods, and it allows for additional analyses, such as surface area, macro-porosity, connected pore network and macro-particle shape analysis. The method is tested and directly compared for the same samples to the traditional waxing Archimedes method, with good correlation. The microCT scans of waxed samples also indicate sources of possible error in the waxing Archimedes method by visualising trapped air and wax penetration into open pore spaces. The method is then applied to cores and local bulk density measurements, and their variability down the cores is demonstrated, which can be very useful in complex soil profiles. The method is robust in varying resolution and image blur as it makes use only of volumetric measurements of the entire sample, not image grey-value calibration or segmentation of pore spaces.
Keywords: microCT, soil bulk density, Archimedes method, local bulk density
INTRODUCTION
Bulk density measurements are routinely used to investigate different soil properties, most commonly to measure soil compaction (Blake 1965; Hâkansson et al 2000). It is also a helpful tool to measure porosity, permeability, hydraulic conductivity, soil water retention and root movement though soil (Edwards et al 1984; Flint & Childs 1984; Vereecken et al 1989). Currently there are four standard methods to determine soil bulk density, namely the clod, core, excavation and radiation methods (Blake 1965).
The clod, core and excavation methods consist of weighing the sample and calculating its volume through the Archimedes displacement principle, with only the sample collection being the differentiating factor. The radiation method uses gamma radiation to measure the absorbed or scattered radiation in-situ down a drill hole combined with relevant standards for the investigated soil types (Davidson et al 1963; Blake 1965). The radiation method is fast, causes little soil disturbance, and multiple measurements are possible on the same spot. The drawbacks of the method are that the radiation can be dangerous if not properly shielded, and the method can provide incorrect values if the soil contains an abundance of heavy elements or large stones.
The clod method is the most commonly used, with its advantages mainly consisting of easy sample collection of undisturbed soil and easy volume calculation with the Archimedes displacement principle. Despite these advantages, it is difficult to accurately calculate the bulk density of the fine-earth fraction of a sample with large stones or high gravel content (Page-Dumroese et al 1999; Hirmas & Furquim 2006). During the wax-coating process, the wax has the potential to penetrate cavities or trap air bubbles between the surface of the clod and the wax, influencing the accuracy of the volume calculation. The bulk density of a single clod only provides information on a single section/layer of the soil and cannot provide information on how the bulk density changes down a soil profile. In order to do this individual clods have to be collected down the profiles at different positions, which is labour-intensive and time-consuming. The core method helps to solve this problem by inserting cylindrical rings at intervals down a soil profile (Blake & Hartge 1986). However, the size of the rings limits the resolution of the bulk density measurement down the profile, and inserting the rings becomes difficult in hard gravelly soil and tends to disturb the soil in the process (Hirmas & Furquim 2006).
Previous studies that used X-ray CT for the bulk density measurement of soils used grey value calibrations by measuring the attenuation of X-rays as they penetrate the soil (Petrovic et al 1982; Anderson et al 1988; Jenssen & Heyerdahl 1988; Timm et al 2005). In one case, Crestana et al (1986) built a soil mini-scanner to calculate the different X-ray attenuation coefficients of soil in order to calculate bulk density in the field. The abundance of large stones or heavy elements, as encountered for example by Clarke et al (2016), would cause artefacts influencing the attenuation, resulting in an apparent significantly increased and inflated bulk density (Petrovic et al 1982). These previous studies using medical CT scanners took place before laboratory-based high-resolution microCT systems became broadly available. In recent years, laboratory-based X-ray microCT has become more accessible through the establishment of multi-user facilities (Du Plessis et al 2016). As a result, a growing number of researchers in the earth and pedology sciences have made use of the technology to perform non-destructive analysis on various geological materials, including rocks, drill cores and soils (Cnudde & Boone 2013; Ketcham & Carlson 2001; Ketcham 2005; Taina et al 2008). In the thorough review by Cnudde and Boone (2013), it was highlighted that numerous different analysis types can be performed on a single sample, including porosity, permeability and particle size. This procedure typically involves image analysis adapted to every sample type and analysis requirement.
In general, density measurement by CT and microCT involves the use of known reference standards and calibration of grey values, and has been applied to soils with some success (Petrovic et al 1982; Anderson et al 1988; Crestana et al 1986). This has also been successfully applied to other material types, and works well for plastics (Du Plessis et al 2013), biological materials such as maize (Guelpa et al 2016) and fruit (Arendse et al 2016). However, soils are very heterogeneous and the chemistry may vary significantly, affecting such grey value methods as mentioned above.
Therefore, in this study we demonstrate a new method which does not depend heavily on image segmentation or on grey-value calibrations. The method involves determining the total volume of the sample from a basic thresholding procedure from the microCT data, and subsequent weighing of the same sample. The method is independent of the sample chemistry and requires only a good microCT scan to accurately determine the location of the edge of the sample. The results of the new method are directly compared for the same samples to the more traditional Archimedes method. The same method is applied to full, undisturbed soil cores to illustrate its potential practical application. Additional to this, the method is modified to allow calculation of the local changes in bulk density down undisturbed soil cores at higher resolution than is currently possible by traditional methods. The work illustrates the additional data that is available from the microCT datasets, which includes the macro-porosity, pore size, shape and surface area as illustrated by Peyton et al (1992) and Shin et al (2013).
MATERIALS AND METHODS
Sample collection
Samples collected for this study consist of three different soil types, namely clay soil, sandy soil and an organic-matter-rich (OMR) soil, all collected from different locations in the Western Cape Province of South Africa. The clay soil originated from a kandic horizon of an alfisol located on the Welgevallen experimental farm at Stellenbosch University. The sandy soil was collected from an ochric epipedon of an entisol, located approximately 20 km west of Stellenbosch. The OMR soil originated from an umbric epipedon of an alfisol located in the Jonkershoek Nature Reserve in the Jonkershoek Valley close to Stellenbosch.
Sampling consisted of collecting clods and cores. Clods were collected for the clay soil, but no coring of this soil was possible, as it was too dry and hard for a corer to penetrate. The clod sizes selected in this study were 130 mm, 85 mm and 35 mm. Core samples were taken from the sandy and OMR soils, and in this case no clods could be collected, due to the apedal nature of these soils. Three standard PVC pipes were used to extract vertical core samples (one of sandy soil and two of OMR soil). To assist in penetrating the soil when hammering the pipe into the ground, the edge of each pipe was sharpened (Peyton et al 1992). Sealing the cores with tape at the top and bottom after extraction helped to prevent any soil loss during transport, which is similar to the method used by Peyton et al (1992). The outer diameter of the PVC pipes was 40 mm in the case of the sandy soil, and 50 mm for the high OMR soil. Lengths of the PVC cores varied as follows, with a pipe thickness of 2.5 mm:
■ Sandy soil core 480 mm
■ OMR soil 1 230 mm
■ OMR soil 2 480 mm.
MicroCT
In previous studies investigating bulk density measurements with X-ray CT the emphasis was on measuring the X-ray attenuation of the soil and relating that to density (Petrovic et al 1982; Anderson et al 1988; Jenssen & Heyerdahl 1988; Crestana et al 1986). In this study a typical laboratory microCT is used to not only image, but also measure the volume of the sample. Scan procedures and setup guidelines are discussed in more detail in Du Plessis et al (2017), but are briefly summarised here for soil clods and cores.
For highest magnification, the number of images recorded is between 2 000 and 3 000 as the sample rotates through a full 360 degrees. The different X-ray attenuation coefficients of the material result in different brightness values in the X-ray images. These X-ray images are used to reconstruct a 3D model of the data, which can be used to accurately measure the total volume of the sample or of selected internal features. All the microCT scans were performed at the CT Scanner Facility at Stellenbosch University with a GE Phoenix v|tome|x L240 system and data processing in Volume Graphics VGStudioMax 3.0 (Du Plessis et al 2016). The field-moist and wax-coated oven-dry clay soil clods were scanned at 200 kV and 140 μΑ at 100, 50 and 25 μm resolution. The sandy soil core was scanned at 150 kV and 100 μΑ with 50 μm resolution, and lastly the two high OMR soils were scanned at 100 kV and 200 μΑ with 50 μm resolution. The clods were scanned at higher voltage to ensure no artifacts were present due to unexpected dense particles and due to the complex shape of the samples. The cores were scanned at lower voltages to enhance the contrast, especially for low density organic matter. Cores were scanned in sections to allow the highest possible resolution using multi-scan procedures described in Du Plessis et al (2017).
Data processing
The three clod and three core samples collected for the experiments were first microCT-scanned in their field-moist condition before any additional, potentially destructive analyses were performed. Next, the dry density of each soil clod was determined using the Archimedes displacement method as described by Blake and Hartage (1986). These results were compared to the results calculated from the microCT method, as described below, to validate the repeatability of this method. This validation was performed with dried samples (dry density). The three representative clod samples were oven-dried at 102°C for 24 hours. The weight of internal water for each was determined by measuring the mass difference before and after drying. The sample weight was determined both in air and in water with a lab scale to measure how much water each sample displaced, to calculate the volume. The data processing from microCT scans of clods was performed using Volume Graphics VGStudio Max 3.0. A basic threshold segmentation with an advanced surface determination was used, as described in a different study on mineral volumetric quantification in Le Roux et al (2015). This allows an accurate determination of the volume of the clod sample.
Similar to the procedure for clod samples, each core sample was microCT-scanned prior to drying, to prevent any possible structural changes to the soil in the drying process, as done by Peyton et al (1992). The core samples were weighed before and after drying to measure the moisture content in each core. Similar to the clod samples a surface determination was performed to calculate the volume of the soil in each core from microCT data. In this case the volume of the PVC pipe surrounding the soil was removed by selecting the pipe and creating a region of interest, with a region-growing tool. After the soil was digitally extracted from the pipe, an advanced surface determination was performed for an accurate volume measurement.
RESULTS AND DISCUSSION
Bulk density of clod samples
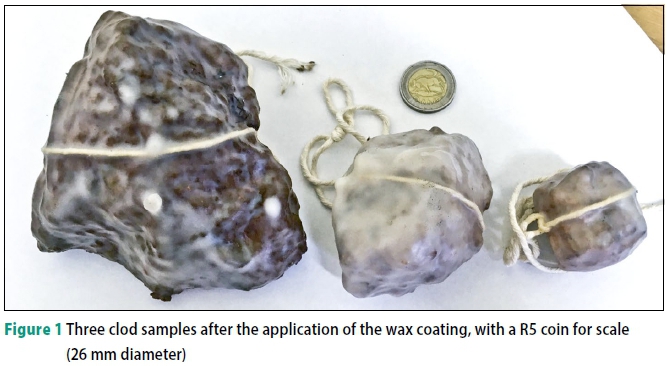
Three clods of different sizes of the clay-rich kandic horizon were selected for direct comparison between microCT and Archimedes dry density measurements. Since the traditional Archimedes clod method requires application of wax, the clods were scanned prior to waxing for the microCT-based density determination. They were additionally scanned after waxing in this study to highlight sources of potential errors in the Archimedes method. The three clods are shown in Figure 1, together with a R5 coin (diameter 26 mm) for scale.
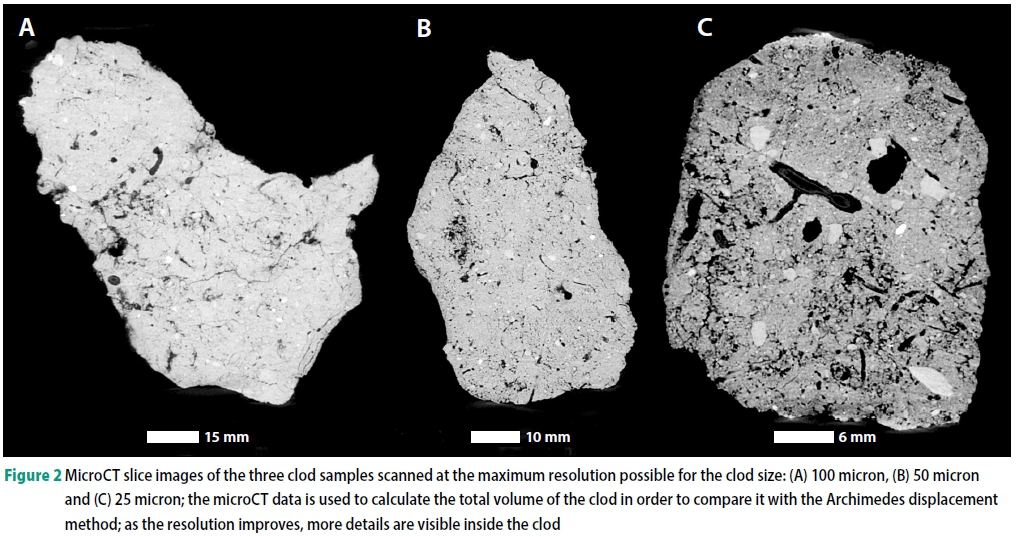
MicroCT scans of these clods were conducted at the maximum possible resolution for each clod, resulting in typical slice images, as shown in Figure 2 at 100 μm, 50 μm and 25 μm resolution, respectively.
Resolution limitations are due to sample size, with higher resolutions being possible as sample size decreases. The higher resolution scans provided more detail of both internal and external features, improving the accuracy of volume measurements of porosity as smaller pore spaces were detected.
To calculate the clod volume from the microCT data a simple segmentation is performed by removing the air surrounding the clod and calculating the total volume of the clod including the internal pore spaces. This is done using the segmented region of interest and using the volume-analyser tool. The measured volume is based on image analysis, but is not dependent on the ability to visualise pore spaces and is therefore robust to image blur or different scan resolutions. Dividing the dry weight of the clod by the microCT-measured volume provides a simple calculation of the dry density of the clod sample. These results are compared with the results calculated by the Archimedes displacement principle (Blake & Hartge 1986) on the exact same samples, subsequent to microCT scans, with results presented in Table 1. The dry density is calculated for microCT and Archimedes as follows:
Dry density (Archimedes)
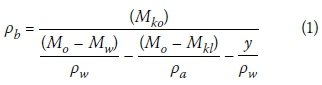
Where
Pb= bulk density of the soil (g/cm3)
pw= density of water at the temperature of water at the time of measurement in °C
pa= density of wax (g/cm3)
Mko= oven-dried weight of soil (g)
Mkl= mass of soil before oven-drying (g)
Mo= mass of wax-covered soil in air (g)
Mw= mass of wax-covered soil in water (g)
and
y = mass of string in water.
Dry density (microCT)
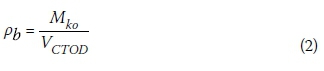
Where
Pb= bulk density of the soil (g/cm3)
Mko= oven-dried weight of soil (g) and
Vctod= microCT-calculated volume of soil (cm3).
Additionally the bulk density of each clod sample was calculated using the field-moist weight of each clod and the volume calculated from the field-moist microCT scans of each clod sample (Table 1).
Bulk density (microCT)
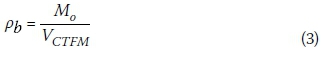
Where
Pb= bulk density of the soil (g/cm3)
Mo= field-moist weight of soil (g) and
Vctfm= microCT-calculated volume of soil (cm3).
Table 1 indicates that the dry density calculation from the Archimedes and microCT methods compare well, with dry density results within less than 0.044 g.cm-3. The largest difference of 0.044 g.cm-3 is found for sample C, which is the smallest clod. All three clods were also analysed by microCT after waxing (as shown in Figure 3), and it was observed that there were areas where open cavities were filled with wax, and areas where air bubbles were trapped between the wax and the clod surface. The wax penetration into the sample would provide a smaller wax displacement than expected, causing an increase in the total calculated volume of the clod, thereby decreasing the calculated dry density in Equation 1. In both samples A and B, the difference in measured dry density is very small, only 0.002 g.cm-3. In these samples, small areas of wax infiltration were observed; however, the contribution to the overall change in volume was expected to be small due to the low ratio of wax-to-clod material.

The microCT dry density of sample C is lower by 0.044 g.cm-3 compared to the value calculated from the Archimedes method. This difference can be explained by the presence of air bubbles trapped between the clod surface and wax (see Figure 3). This results in an increased calculated wax volume, reducing the total volume of the clod, thereby increasing the calculated bulk density by Archimedes in Equation 1. Due to the larger wax-to-clod ratio of the smaller sample these small changes in volume calculation can be expected to have a more noticeable influence on the bulk density calculation. In this case the microCT analysis provides a more accurate calculation of the volume and dry density of the sample.
With these results, the conclusion is that it is possible to accurately calculate the density of soil samples from microCT scan data. Additionally the bulk density of these samples were calculated form the microCT data of the clods (Table 1), scanned and weighed before the samples were dried.
Since microCT is deemed more accurate, it may be used for ground-truth studies using large numbers of bulk density measurements via the Archimedes method. It could be used in combination or entirely replace the traditional method, especially for fragile clods which may be disturbed by waxing, or when time is important (the clod method is more time-consuming, as it requires overnight drying of the wax, whereas the CT method needs only one hour in total per sample).
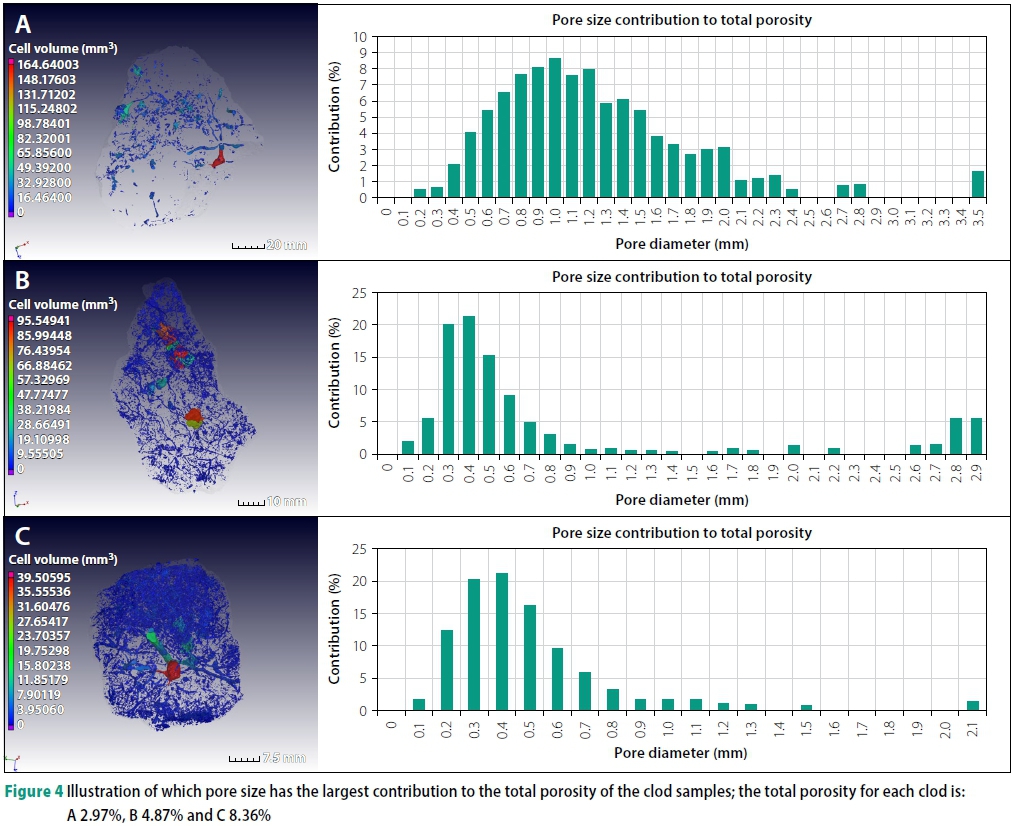
In addition, the microCT data provides the opportunity to extract more details from each clod sample, including the surface area, macro-porosity, connected pore network and macro particle shape (Figure 4). The surface area is an additional result calculated during the initial volume-calculation step mentioned above, and provides an indication of the soil texture. To determine the internal porosity, all the internal air is selected and the "foam structure" module is used to provide data for every separate pore space - i.e. volume, surface area, diameter, sphericity. Macro-pores are analysed with typically a minimum diameter of 3 voxels - i.e. for a 25 μm scan, the smallest-diameter pore space that can be measured is 75 μm in diameter. These results in turn can be used to calculate the overall contribution of differently sized pores to the total porosity of the sample. Figure 4 indicates that the highest contribution to the total porosity of clods A, B and C are pores with diameters of 1 mm, 0.4 mm, and 0.4 mm, respectively.
The total porosity of each sample is as follows: A 2.97%, B 4.87% and C 8.36%. These values are only accurate for macro-porosity, as micro-porosity is typically missed in the segmentation process and depends on the sample and the resolution of the scan. Therefore, the higher the resolution and smaller the sample, the more accurate the porosity measurement is, but there is a possible loss of representability as the samples become too small. Therefore, as a guide, clods should be scanned at a fixed resolution for direct comparison of macro-porosity.
Bulk density of core samples
The microCT-based bulk density determination was also applied to undisturbed soil core samples. The ability to provide local bulk density along the core, and visually assess the reasons for variations, adds a new dimension to soil bulk density measurements. In this demonstration of the method, three cores were selected: two organic-matter-rich (OMR) soils, and one sandy soil. After the cores were extracted in the field as indicated above, the complete core was scanned at highest possible resolution without any further sample preparation. The images in Figures 5-7 provide an overview of the three cores and illustrate the changes in internal features of each of the cores down the profile.


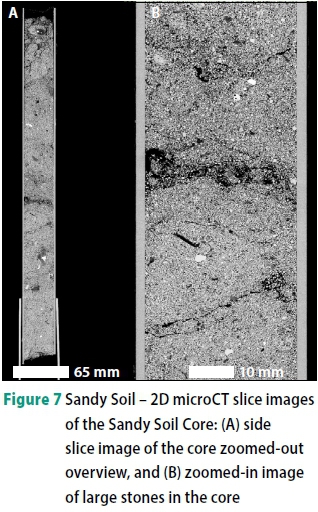
Figure 5 shows OMR Soil 1; this soil has a more sandy texture with some larger, coarser grains visible. Cracks are present at the top of the core with some larger voids visible down the profile, while some textural layering/sorting is also observed. The non-horizontal layering in this sample is possibly due to previous soil collapse.
OMR Soil 2 (Figure 6) has the highest organic matter (6.32% carbon) content, and more gravel with higher density, compared to the surrounding material, is observed. There is no obvious layering and the material seems to be more evenly distributed in the core.
The observations made of the sandy soil core (Figure 7) are noticeably different than for the OMR soils. The biggest part of the soil comprises fine-grained particles with larger low density particles randomly distributed in the core. Pore spaces are small, and fine horizontal cracks are visible down the core profile.
The total bulk density of each field-moist core was calculated from the microCT-derived volume. In this case the soil was segmented from the tube in a relatively simple manner. First, the air surrounding the core is removed by selecting it with a region-growing tool identifying it as a region of interest (ROI). This air ROI is inverted identifying the plastic core and internal soil as a separate ROI. This core and soil ROI are extracted into its own volume. The region-growing tool is applied again only on the PVC pipe in this case, inverting the PVC ROI identifying the soil as its own ROI. The soil-only ROI is used to calculate the volume of the soil inside the core. The total weight of the field-moist soil is calculated by subtracting the weight of the tube (weighed before sample collection) from the mass of the tube and soil. The resulting total bulk density is calculated according to Equation 3, as before.
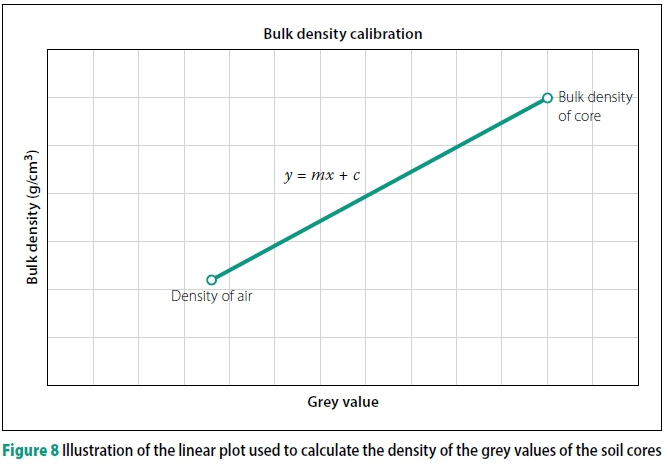
In addition, local bulk density down the soil profile could be determined for each core. In order to do this the density of each grey value in the scan volume has to be calibrated. To do this a scan calibration is employed for every core as follows: the calculated bulk density (from above) and the average grey value of the soil core are plotted against the density of air at 22°C (1.225 χ 10-3 g/cm3) and the average grey value of the air surrounding the core. The equation from the linear fit between the two points can be used to calculate the relative density of specific grey values in the dataset (Figure 8).
The core was virtually divided into similarly sized regions of interest spaced equally down the core in the microCT dataset. The average grey value for each region was measured and the average bulk density of each of these regions calculated from the equation derived from the plot, as illustrated in Figure 8. The results of the analysis are plotted against distance down the core to visualise the change in bulk density down the core (Figure 9). The results help to visualise the changes in bulk density moving down the soil core, as well as illustrate the difference in average bulk density of the core when plotted on the same graph. The standard deviation along the profile gives an indication of the homogeneity of the bulk density value, as shown in Table 2.

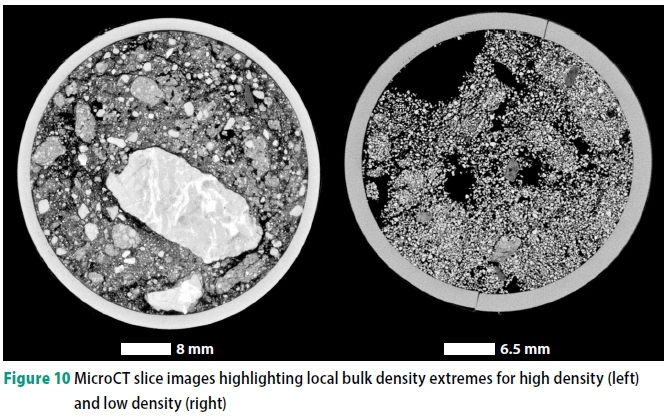
Local extremes can be investigated in the microCT dataset, as demonstrated for high- and low-density local features in two of the cores shown in Figure 9. At a depth of around 200 mm in OMR Core 2 there is a positive increase in bulk density: from the 2D slice image in Figure 10 it is visible that a brighter high-density stone is present in this region causing the spike in bulk density. In the case of the Sandy Soil Core a negative change in bulk density is observed at around 250 mm depth. From the 2D image in Figure 10 it can be identified that there is a large pore space in that region.
In practice this method can be used in combination with the disk method, and can provide useful additional information, especially for complex soil profiles. The ability to visualise and quantify bulk density changes along a profile, quantify the homogeneity of the profile and attribute local changes to specific types of internal features, is sure to add value to soil characterisation studies.
CONCLUSION
This work provides a new methodology for measuring bulk density of soil clods and undisturbed soil cores using laboratory microCT. It makes use of a simple volume determination from microCT data of clods or cores, which is not dependent on image resolution, as is often encountered with microCT image analysis. Additional qualitative and quantitative information on soil structure, including macro-porosity, is available, making the method a valuable addition to soil studies. It was demonstrated that the method can eliminate some problems with existing methods, such as trapped air between clod and wax, and wax penetration affecting the Archimedes measurement. For both clods and cores, total bulk density was calculated for three typical samples. For cores, a local bulk density along the core profile was demonstrated, homogeneity quantified by standard deviation of bulk density along the profile and local extremes investigated and attributed to an unexpected rock (high local density) and a large pore space (low local density). The simplicity of the method demonstrates its valuable visual aspect, and the relatively easy and growing accessibility of microCT laboratory facilities allows this method to be used in various soil characterisation studies.
REFERENCES
Anderson, S H, Gantzer, C J, Boone, J M & Tully, R J 1988. Rapid nondestructive bulk density and soil-water content determination by computed tomography. Soil Science Society of America Journal, 52(1): 35-40. [ Links ]
Arendse, E, Fawole, O A, Magwaza, L S & Opara, U L 2016. Estimation of the density of pomegranate fruit and their fractions using X-ray computed tomography calibrated with polymeric materials. Biosystems Engineering, 148: 148-156. [ Links ]
Blake, G R 1965. Bulk density. In Black, C A (Ed.). Methods of Soil Analysis. Part 1. Physical and Mineralogical Properties, Including Statistics of Measurement and Sampling. Madison, IL: Agronomy and Soil Science Society of America, pp 374-390. [ Links ]
Blake, G R & Hartge, K H 1986. Bulk density In Klute, A (Ed.) Methods of Soil Analysis. Part 1. Physical and Mineralogical Methods, 2nd ed. Madison, IL: Agronomy and Soil Science Society of America, pp 363-375. [ Links ]
Clarke, C E, Majodina, T O, Du Plessis, A & Andreoli, M AG 2016. The use of X-ray tomography in defining the spatial distribution of barite in the fluvially derived palaeosols of Vaalputs, Northern Cape Province, South Africa. Geoderma, 267: 48-57. [ Links ]
Cnudde, V & Boone, M N 2013. High-resolution X-ray computed tomography in geosciences: Review of the current technology and applications. Earth-Science Reviews, 123: 1-17. [ Links ]
Crestana, S, Cesareo, R & Mascarenhas, S 1986. Using a computed tomography miniscanner in soil science. Soil Science, 142: 56-61. [ Links ]
Davidson, J M, Biggar, J W & Nielsen, D R 1963. Gamma-radiation attenuation for measuring bulk density and transient water flow in porous materials. Journal of Geophysical Research, 68(16): 4777-4783. [ Links ]
Du Plessis, A, Meincken, M & Seifert, T 2013. Quantitative determination of density and mass of polymeric materials using microfocus computed tomography. Journal of Nondestructive Evaluation, 32(4): 413-417. [ Links ]
Du Plessis, A, Le Roux, S G & Guelpa, A 2016. The CT scanner facility at Stellenbosch University: An open access X-ray computed tomography laboratory. Nuclear Instruments and Methods in Physics Research. Section B: Beam Interactions with Materials and Atoms, 384: 42-49. [ Links ]
Du Plessis, A, Broeckhoven, C, Guelpa, A & Le Roux, S G 2017. Laboratory X-ray micro-computed tomography: A user guideline for biological samples. GigaScience, 6(6): 1-11. [ Links ]
Edwards, W M, Germann, P F, Owens, L B & Amerman, C R 1984. Watershed studies of factors influencing infiltration, runoff, and erosion on stony and non-stony soils. In Grant, W J (Ed). Erosion and Productivity of Soils Containing Rock Fragments, Madison, IL: Agronomy and Soil Science Society of America, pp 45-54. [ Links ]
Flint, A L & Childs, S 1984. Development and calibration of an irregular hole bulk density sampler. Soil Science Society of America Journal, 48(2): 374-378. [ Links ]
Guelpa, A, Du Plessis, A & Manley, M 2016. A high-throughput X-ray micro-computed tomography μCT) approach for measuring single kernel maize (Zea mays L.) volumes and densities. Journal of Cereal Science, 69: 321-328. [ Links ]
Hâkansson, I & Lipiec, J 2000. A review of the usefulness of relative bulk density values in studies of soil structure and compaction. Soil and Tillage Research, 53(2): 71-85. [ Links ]
Hirmas, D R & Furquim, S A C 2006. Simple modification of the clod method for determining bulk density of very gravelly soils. Communications in Soil Science and Plant Analysis, 37(7-8): 899-906. [ Links ]
Jenssen, P D & Heyerdahl, P H 1988. Soil column descriptions from X-ray Computed Tomography density images. Soil Science, 146(2): 102-107. [ Links ]
Ketcham, R A & Carlson, W D 2001. Acquisition, optimization and interpretation of X-ray computed tomographic imagery: Applications to the geosciences. Computers & Geosciences, 27(4): 381-400. [ Links ]
Ketcham, R A 2005. Computational methods for quantitative analysis of three-dimensional features in geological specimens. Geosphere, 1(1): 32-41. [ Links ]
Le Roux, S G, Du Plessis, A & Rozendaal, A 2015. The quantitative analysis of tungsten ore using X-ray microCT: Case study. Computers & Geosciences, 85: 75-80. [ Links ]
Page-Dumroese, D S, Brown, R E, Jurgensen, M F & Mroz, G D 1999. Comparison of methods for determining bulk densities of rocky forest soils. Soil Science Society of America Journal, 63(2): 379-383. [ Links ]
Peyton, R L, Haeffner, B A, Anderson, S H & Gantzer, C J 1992. Applying X-ray CT to measure macropore diameters in undisturbed soil cores. Geoderma, 53(3-4): 329-340. [ Links ]
Petrovic, A M, Siebert, J E & Rieke, P E 1982. Soil bulk density analysis in three dimensions by computed tomographic scanning. Soil Science Society of America Journal, 46(3): 445-450. [ Links ]
Shin, H S, Kim, K Y & Pande, G N 2013. Porosity and pore-size distribution of geomaterials from X-ray CT scans. In Laloui, L & Ferrari, A (Eds). Multiphysical Testing of Soils and Shales, Berlin & Heidelberg: Springer Science & Business Media, pp 177-186. [ Links ]
Taina, I A, Heck, R J & Elliot, T R 2008. Application of X-ray computed tomography to soil science: A literature review. Canadian Journal of Soil Science, 88(1): 1-19. [ Links ]
Timm, L C, Pires, L F, Reichardt, K, Roveratti, R, Oliveira, J C M & Bacchi, O O S 2005. Soil bulk density evaluation by conventional and nuclear methods. Soil Research, 43(1): 97-103. [ Links ]
Vereecken, H, Maes, J, Feyen, J & Darius, P 1989. Estimating the soil moisture retention characteristic from texture, bulk density, and carbon content. Soil Science, 148(6): 389-403. [ Links ]
 Correspondence:
S G le Roux
CAF CT Scanner Facility Stellenbosch University
Private Bag X1 Matieland 7602 South Africa
T: +27 21 808 9389 E: lerouxsg@sun.ac.za
A du Plessis
Department of Physics Stellenbosch University
Private Bag X1 Matieland 7602 South Africa
T: +27 21 808 9389 E: anton2@sun.ac.za
C E Clarke
Soil Science Department Stellenbosch University
Private Bag X1 Matieland 7602 South Africa
T: +27 21 808 3659 E: cdowding@sun.ac.za

STEPHAN LE ROUX is a researcher at the Stellenbosch University CT facility. His main expertise lies in image analysis of X-ray microCT scans. At the moment he is using these skills in soil science research to investigate the physical properties of soils in contaminated waste sites. He has published 30 journal papers.

PROF ANTON DU PLESSIS is an Associate Professor at Stellenbosch University. His research interests lie in applications of X-ray microCT, additive manufacturing and biological structures (specifically biomimicry). He has published 80 journal papers.

DR CATHY CLARKE is a lecturer in the Soil Science Department at Stellenbosch University. Her interests lie in the development of soil science and making scientific contributions to the field.
