


Services on Demand
Journal

Article
 English (pdf)
 Article in xml format
 Article references
 Send this article by e-mail
Indicators
Related links
-
 Cited by Google
 -
 Similars in Google
Share

 Permalink
South African Journal of Science
On-line version ISSN 1996-7489Print version ISSN 0038-2353
S. Afr. j. sci. vol.116 n.3-4 Pretoria Mar./Apr. 2020
https://doi.org/10.17159/sajs.2020/6557
RESEARCH ARTICLE
Automatic classification of social media reports on violent incidents in South Africa using machine learning
Eduan KotzéI; Burgert A. SenekalII; Walter DaelemansIII
IDepartment of Computer Science and Informatics, University of the Free State, Bloemfontein, South Africa
IIDepartment of South African Sign Language and Deaf Studies, University of the Free State, Bloemfontein, South Africa
IIICLiPS Research Centre, University of Antwerp, Antwerpen, Belgium
ABSTRACT
With the growing amount of data available in the digital age, it has become increasingly important to use automated methods to extract useful information from data. One such application is the extraction of events from news sources for the purpose of a quantitative analysis that does not rely on someone needing to read through thousands of news articles. Overseas, projects such as the Integrated Crisis Early Warning System (ICEWS) monitor news stories and extract events using automated coding. However, not all violent events are reported in the news, and while monitoring only news agencies is sufficient for projects such as ICEWS which have a global focus, more news sources are required when assessing a local situation. We used WhatsApp as a news source to identify the occurrence of violent incidents in South Africa. Using machine learning, we have shown how violent incidents can be coded and recorded, allowing for a local level recording of these events over time. Our experimental results show good performance on both training and testing data sets using a logistic regression classifier with unigrams and Word2vec feature models. Future work will evaluate the inclusion of pre-trained word embedding for both Afrikaans and English words to improve the performance of the machine learning classifier.
SIGNIFICANCE:
• The logistic regression classifier using TFIDF unigram, CBOW and skip-gram Word2Vec models were successfully implemented to automatically analyse and classify WhatsApp messages from groups that share information on protests and mass violence in South Africa. At the time of publishing, messages were collected from 26 WhatsApp groups across South Africa and automatically classified on an hourly basis.
Keywords: WhatsApp, text classification, Word2Vec, protests, open-source intelligence, OSINT
Introduction
Social media has evolved rapidly during the past few years and has become an increasingly popular platform for acquiring opinions and information about events.1 Popular social media platforms include online social networks, microblogs, wikis, media sharing and reviews.2 Text mining is often used to mine information from the natural language text generated in these platforms.3 A functional text analytic application would typically include natural language processing, information retrieval and machine learning, together with linguistics and statistical techniques to extract information from text.3
One text mining technique is text classification, which is often considered one of the fundamental tasks in natural language processing. In text classification, supervised machine learning is used to assign a label or probability value to an instance (i.e. sentence or text document). However, other variations of text classification also allow the assignment of multiple labels to an instance. These labels could be continuous values, but, generally, the classification problem assumes categorical or binary (i.e. 0 or 1) values for the labels.4 For the purpose of this study, we focus on text classification as the main text mining technique. Our objective is to gain insight into the linguistic aspects of reports about violent incidents in South Africa by collecting, annotating and classifying a user-generated data set. We explore the text characteristics (features) that are potentially useful in distinguishing between events and non-events, and apply these features in several machine-learning algorithms.
Text classification
Text mining applications play an important role in knowledge discovery as the volume and diversity of digital texts have increased significantly.5 Popular text mining applications include email classification, spam filtering, categorising news articles or autotagging customer queries, sentiment analysis and opinion mining.6,7 These examples are known as text classification applications and involve the assignment of labels to data (called annotation), using this labelled data as training data for supervised learning of a classifier, and then using this classifier to label (or predict) unlabelled documents.8,9 The focus of any text classification application is to classify a single object into a discrete class by extracting useful features (attributes) from the object. Features - or the set of attributes, represented as a vector - could for example be words extracted from the text. A classification model typically relates the features in the underlying record to one of the class labels. Machine-learning algorithms are used to construct a classification model and predict the class label (binary, multiclass, multilabel) of a new text document. For this study, we made use of a supervised multi-class machine-learning classifier in which a document is assigned to one class among several possible classes.
Related research
The automatic classification of text is a well-known natural language processing research problem for which there has been an extensive history of scholarly work.7 However, in the context of defence and security, more work is required to automatically classify news reports related to emergency information. Several initiatives to extract information automatically from news sources have been launched overseas. Examples include the Policon model10-12, which has been used by the US Central Intelligence Agency (CIA)13, and Senturion14, which has been used by the US Department of Defense13. Lockheed Martin's Integrated Crisis Early Warning System extracts structured data from news.13 Other similar projects include the CIA's Political Instability Task Force15-17, the Armed Conflict Location and Event Data project18, the Uppsala Conflict Data Program19,20, and the Social Conflict Analysis Database (SCAD)21. See Schrodt22 for a discussion of similar projects.
Our project differs from these projects in a number of ways. In those projects, not all events are shared by the main news agencies, as limited space and resources compel them to focus on larger events.23,24 We required a more comprehensive data set as our outlook is local and not global. In addition, people no longer rely solely on mainstream media to access information. We therefore turned to WhatsApp as a news source. WhatsApp is a free messaging service owned by Facebook which enables users to message, call and share files. WhatsApp has become increasingly popular as a source of news25; the use of WhatsApp for news has almost tripled since 2014 in many countries.26 In South Africa, WhatsApp is also used regularly to share emergency information.27
Data collection and annotation
Data collection
Messages were collected from a variety of WhatsApp groups (group chat is a feature in which the same message can be sent at the same time to multiple contacts who opt in), which cannot be named for ethical reasons. Most operate within the Afrikaans and English communities (urban and rural) across South Africa and focus on protests and serious crimes, such as hijackings, cash-in-transit robberies and farm attacks. The majority of messages are eyewitness accounts, and while a much smaller number come from mainstream news agencies, these cover a wide spectrum of the South African media. Numerous messages also come from Facebook groups and from Twitter. It should be noted that the groups were selected based on their activity and dedication to accuracy. None of these groups deliberately spread false news and while an incident may later be shown to have been false, our objective is not to establish crime statistics but rather to classify the messages themselves.
Because WhatsApp is a closed platform, we first had to obtain ethical clearance and permission to be added to WhatsApp groups that share information on violent incidents. Ethnical clearance was granted for this project by the General/Human Research Ethics Committee of the University of the Free State (UFS-HSD2019/0175).
Data were collected from 15 WhatsApp groups between 30 May 2018 and 18 February 2019. In total, 23 360 WhatsApp messages were retrieved in either English or Afrikaans. After filtering the corpus for and removing duplicate messages, the experimental corpus comprised 8398 unique messages.
Data preparation
Text pre-processing is required because online social media data tend to be very 'noisy' and contain uninformative parts, such as HTML tags.28
We followed the basic linguistic processing steps required to prepare the lexical source for text classification. This processing included data cleaning, removal of stopwords, tokenisation, as well as syntactic parsing.29 One of the first steps was message and sentence tokenisation. All the messages in the WhatsApp data set were stored as either single or multiline messages. We separated each multiline message into several single-line messages. Using regular expressions, we identified multiline messages and converted them into the following single-line message format: [date, time] + [From]: [Message]. UTF-8 file encoding was performed during the file reading operation to avoid character set conversion errors. Next, all punctuation marks and special characters, including emoticons, were removed from each text message. HTML tags such as web addresses ('' and 'www') were also stripped from the text message, followed by white space removal and text lowercasing. Text messages that contained contractions, slang words and hyphenated words were transformed into regular expressions using a custom dictionary (for example, the Afrikaans 'ek't' was converted to 'ek het', and the English 'isn't' to 'is not'; 'Potch' to 'Potchefstroom' and 'CT' to 'Cape Town'). The custom dictionary contained all possible contractions in Afrikaans and English. Misspelled words were identified and normalised, again making use of a custom dictionary. Hyphenated words were reconstructed as hyphens were considered a special character and were removed earlier. We also made use of a lookup dictionary to reconstruct hyphenated words (for example, 'hi jacking' became 'hi-jacking'). All custom and lookup dictionaries were manually constructed using a trial-and-error approach as we identified contracted, misspelled and hyphenated words. Due to the bilingual nature of the corpus, stemming and lemmatisation were not performed. Finally, all stopwords were removed from the corpus. For English words, we made use of the stopword list in NLTK30 and for Afrikaans words, we translated the English stopwords into their corresponding Afrikaans words.
Data annotation
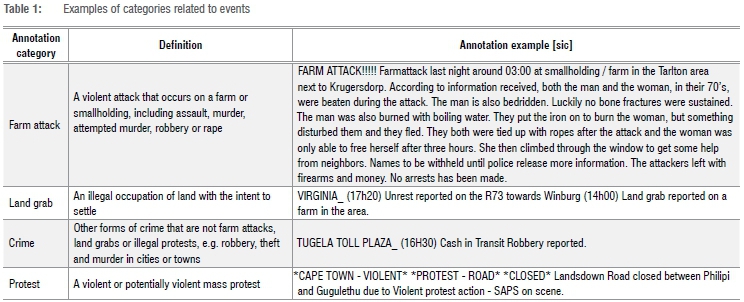
Two annotators were asked to identify whether the text under investigation was related to an event. If the message was considered to be an event, annotators identified the type of event. If not, it was considered a 'safe' message. The four event-related categories identified were: farm attack, land grab, crime and protest. An example of each category is given in Table 1.
Annotation statistics
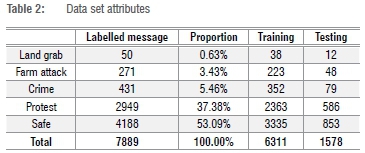
All the messages were independently annotated for event detection by two annotators, A and B, who were postgraduate students familiar with linguistics and the South African environment, and are English second-language speakers. When A and B did not agree, a third annotator functioned as a tiebreaker to obtain a gold standard. The inter-annotator agreement between the two annotators was calculated using Cohen's kappa.31 The agreement score was k=81.72, which indicated substantial agreement. Of the 8395 unique messages, both annotators agreed on 7480 messages. The difference set (n=915) was annotated by two additional annotators, C and D. We implemented a majority-vote algorithm to select annotations in which C and D agreed with either A or B. In this way, 660 annotations were added to the 7480 messages. Further data exploration was conducted to refine the combined corpus (n=8085). All messages shorter than 5 characters or longer than 1000 characters were removed from the corpus. We found that messages that fell outside these length thresholds were mainly informational messages (i.e. 'safe'). The final pre-processed and tokenised data set consisted of 7889 unique messages. After pre-processing the corpus, the data set was split (80/20) into training (n=6311) and testing (n=1578) data sets. The number and classification of each message are shown in Table 2.
Experimental set-up
Feature extraction
Text data are known for their high dimensionality of text features.4 As a result, feature extraction and feature selection are necessary tasks before any text classification can be attempted. For this study, we made use of two popular feature extraction techniques: bag-of-n-gram (n-grams) and term frequency - inverse document frequency (TF-|Df). In n-grams, the presentation model creates sequences of n words instead of frequency counts of single words (bag-of-words).32 The features in n-grams are representations of all combinations of adjacent words of length n in the text. In other words, 2-gram or bigrams will represent a model with combinations of two adjacent words in the text document, while 3-gram or trigrams will be combinations of three adjacent words in a text document. In TF-IDF, weights are created instead of frequency counts. The idea is that terms that frequently occur in a document relative to the number of times they occur in the entire corpus, are more important than terms that occur commonly. Both n-gram and TF-IDF models introduce several shortcomings, such as data sparsity and high dimensionality.33 These phenomena are referred to as 'the curse of dimensionality', which means that, as the feature space increases in dimensions (i.e. character or word tokens), the data become more sparse and less informative to the underlying decision space.34
One solution to overcoming these shortcomings is to make use of more recent models in which word representations are based on large natural language corpora by tracking the contexts in which they occur - known as 'word embeddings'. Word embedding is a language modelling technique used to create a continuous higher dimensional vector space to overcome the curse of dimensionality and represent word meaning.35 A popular language model to produce such word embeddings is Word2Vec.36 Word2Vec is a group of two-layer neural network models that are trained on a large corpus of text to reconstruct the linguistic context of words. Two architectural Word2vec models available to learn the distributed representation of words are continuous-bag-of-words (CBOW) and skip-gram.36 In both these models, techniques are used to learn word weights, which act as word vector representations. The CBOW model predicts the word from a window of surrounding words, while the skip-gram model predicts the context words, given the current word.
Considering this background, we took extra care in constructing the data pipeline for the text classification process and, as far as possible, discarded non-relevant words without influencing the text classification outcome. We opted for TF-IDF instead of frequency counts (bag-of-words) because TF-IDF considers the inverse document frequency of each term when performing raw term frequency computations, and thus often produces better results.37 The following feature types were extracted from both data sets:
• Word n-gram TF-IDF: features indicating the frequently occurring unigrams (1,1) or bigrams (2,2), or unigrams and bigrams (1,2)
• Word2Vec: words to vectors using continuous-bag-of-words (CBOW) and skip-gram models. A function was added to calculate an average of all vectors per message. The function summed all the word vectors occurring in a message and then divided it by the count of the word vectors.
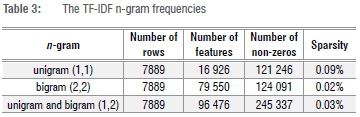
For the first experiment, we extracted TF-IDF features on the training data set using scikit-learn, a machine-learning library for Python.38 Initially, both the minimum (min_df) and maximum (max_df) document/corpus frequencies were set to '1' for all n-gram models. The maximum number of features (top n max_features) was set to 'None' due to the small size of the corpus. Inverse-document-frequency reweighting was enabled (use_idf=True) and, to reduce document length bias, we set norm to 'L2'. The vectoriser created a sparse matrix and the sparsity metric was calculated for both matrixes. The sparsity metric was calculated by dividing the number of non-zero values by the sum of the number of samples and number of features. The lower the value, the sparser are the data in the matrix, making it more challenging to model. The results are given in Table 3.
For feature selection, we used the chi-squared statistic (X2) to find the optimal number of features. We first calculated the estimated mutual information value for a discrete target variable by measuring the dependency between a feature and the target variable. Some of the highest dependency words included unrest (0.09620), farm (0.05994), plaasaanval (0.05105), attack(0.03793), farm attack (0.03070), robbery (0.03006), land (0.02914), invasion (0.01117) and land invasion (0.00859). Thereafter, we used the chi-squared statistic to find the optimal number of features with the highest value. The top 12 features with higher values, i.e. higher usefulness, are depicted in Figure 1.
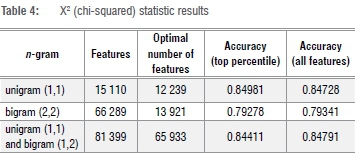
We also examined whether top features would have a significant influence on model accuracy. We used the scikit-learn feature_selection module with the SelectPercentile method which, when given a statistical test, selects a percentile of features with the highest score. We used a decision tree classifier and set the function to measure the quality of a split to 'entropy' (for the information gain) and used the chi-squared statistic for feature selection. Feature selection was repeated for unigrams, bigrams and unigrams with bigrams using cross-validation accuracy as a performance metric on the test set. We found no significant difference in accuracy, and opted to use all unigram and bigram features for our experiments as the number of features was manageable. The chi-squared statistic results are given in Table 4.
For the second experiment, we created word embeddings with Word2vec on the training data set using both CBOW (sg=0) and skip-gram (sg=1) models. The context window size value was set to 6 and the number of features (dimension) to 100. Due to the small corpus of messages, we had to set words with an occurrence count as low as possible (min_ count=1). Words below this threshold were not kept in the vocabulary. Because each WhatsApp message can have a different number of vectors depending on the number of words it contains, a function was added to calculate an average of all vectors per message. We also checked whether the words in a message occur in the vocabulary of the Word2vec model. If the word was not found, the function returned a 0.0, otherwise the average of the word vectors was returned. Both CBOW and skip-gram models produced a vocabulary of 15 114 words from the training corpus.
Data sampling
The experimental corpus features had a heavy class imbalance, distributed as shown in Table 4, with the large majority of posts not being events (i.e. 'safe'). In machine-learning classification, class imbalance can lead to decreased performance and accuracy.39 We were also concerned that the machine-learning algorithms would be biased towards the majority class of no incidents ('safe') and treat the minority classes ('Land Grab', 'Farm Attack', and 'Crime') as outliers and ignore the observations. We applied the Python package imbalanced-learn as data resampling to counter this possibility.40 The methods available included 'over-sampling' and 'under-sampling'. Over-sampling generates new samples in the classes that are under-represented, while under-sampling reduces the number of samples in the targeted classes. We opted for random over-sampling (RandomOverSampler) because of the relatively small number of instances. This method generates new samples in the minority classes ('Land Grab', 'Farm Attack' and 'Crime') by picking samples at random with replacement.
Learning algorithms
From the text classification literature, support vector machines (SVMs), naïve Bayes, decision trees, logistic regression and random forests are popular machine-learning algorithms used to classify text. For the automatic detection of events, we performed text classification experiments using a linear kernel SVM, random forest, gradient boosting machines and logistic regression.
Support vector machines
Support vector machines is a set of versatile supervised learning methods with different kernel functions (linear, polynomial, radial basis function and sigmoid) that can be specified for the decision function. The purpose of a linear kernel classifier is to find a maximum margin hyperplane that can classify data points appropriately. In SVM, we optimised a margin, which is defined as the distance between the separating hyperplane (decision boundary) and the training sample closest to this hyperplane.41 For our experiments, we used the SVM classier with linear kernel (LinearSVC) implemented in LIBSVM.42 The advantage of using LIBSVM over the native Python implementation is that it allows for quick training of large numbers of linear classifiers, as long as the data set fits into computer memory.41
Random forest
Random forest is an ensemble decision-tree algorithm that involves building large numbers of decision trees and then ensembling their outputs.43 Because a random forest is meta-estimated, it fits a number of decision tree classifiers on various sub-samples of the data set and uses averaging to improve accuracy. The function to measure the quality of a split was set to 'gini', which is the default, and used for Gini impurity.
Gradient boosting machines
Gradient boosting machines is a much newer machine-learning technique, and, much like a random forest, it is based on ensembling decision trees. However, it uses gradient boosting to iteratively train new models that address the weak points of previous models.43 The focus of boosting is more to reduce bias than variance, and as a result, boosting tends to improve upon its base models when they have high bias and low variance.44 When comparing the two ensemble methods, random forest trains each tree independently, using a random sample of the data, whereas gradient boosting machines trains one tree at a time, where each new tree is used to correct errors made by a previously trained tree.
Logistic regression
Logistic regression and random forests are text-processing models when using feature-engineering tools such as bag-of-words or n-grams.43 The algorithm used in the optimisation problem (solver) was set to 'newton-cg' as it was a multiclass classification problem. Additionally, multiclass was set to 'multinomial', meaning the loss minimised is the multinomial loss fit across the entire probability distribution. As the 'newton-cg' solver only supports L2 regularisation with primal formulation, the value of the penalisation parameter was set to the default value ('L2').
Model selection
The four classifiers were evaluated as multiclass classifiers (classifying instances into three of more classes). Table 5 shows the hyperparameter combinations for model selection.
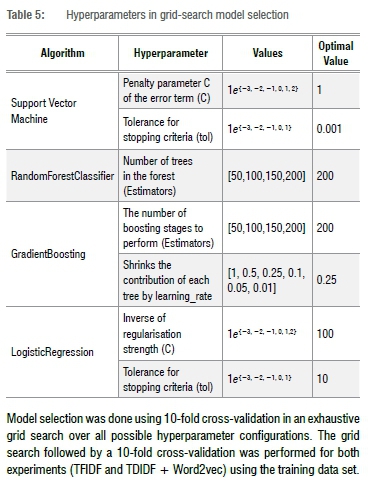
Model selection was done using 10-fold cross-validation in an exhaustive grid search over all possible hyperparameter configurations. The grid search followed by a 10-fold cross-validation was performed for both experiments (TFIDF and TDIDF + Word2vec) using the training data set.
Evaluation measures
Precision, recall, F1-score and accuracy are evaluation metrics used to assess the performance of algorithms in text classification. As we were using a multiclass classifier, calculating the performance metrics was more complicated than for a binary classifier (i.e. only two labels). Measures for a multiclass classifier are based on the generalisation of the binary metrics (described above) making use of either macro-averaging or micro-averaging. Macro-averaging calculates the mean of the binary metrics, while micro-averaging gives each sample-class pair an equal contribution to the overall metric.45 For this study, we used M and u indices to represent the metrics in macro-averaging and micro-averaging. In macro-averaging, precisionM is defined as the average per-class agreement of the data class labels with those of the classifier. RecallM (or sensitivity) is the average per-class effectiveness of a classifier to identify class labels. F-scoreM is the relationship between the sample's positive labels and those predicted by the classifier on a per-class average.
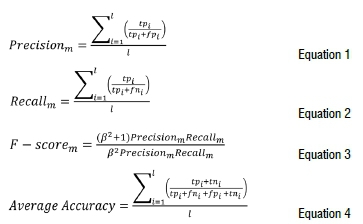
where tp is true positive, tn is true negative, fp is false positive and fn is false negative.
For micro-averaging, we report only the F-scoreu because micro-averaging in a multiclass setting produces precisionu, recallu and F-scoreu that are all identical to accuracy.46
Experiments and results
We discuss the performance of the different models on the training data set, obtained in 10-fold cross-validation, and on the test data set. The accuracy performance evaluation parameter was calculated and used to determine the best performance. We report the accuracy, precision, recall and F-scores for the five event classes.
Results on the training data
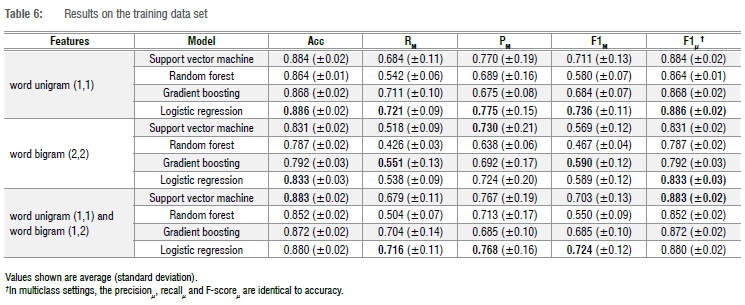
We tested the performance of the four models on the training data using 10-fold cross-validation. When the data set was created it was unbalanced, but as part of the pipeline, random over-sampling was used to address the uneven distribution of classes (see 'Data sampling'). A detailed comparison of all scores can be found in Table 6. The word unigram model obtained the highest score for each model, with the highest training F-scoreM of 0.736 (s.d.=0.11) for the logistic regression classifier.
Results on the test set
We also tested the performance of the four models on the test set, the results of which can be found in Table 7. On the test set, all the word unigram models reached F-scoresM of 0.647 or higher compared to training F-scoresM of 0.580. The reason for a slightly higher performance of the n-gram models compared to the training set results could be sparsity. Because we have a small number of instances, it is possible that some of the unigrams or bigrams in the training set might not have occurred in the testing set. We also included a majority baseline to help contextualise the results. We used a DummyClassifier38 with a strategy set to most_frequent which always predicts the most frequent label (majority class with no incident) in the training set. The baseline classifier scored 0.541 (accuracy), 0.541 (recall), 0.292 (precision) and 0.379 (F-score) using an average weighted by support (the number of true instances of the label).
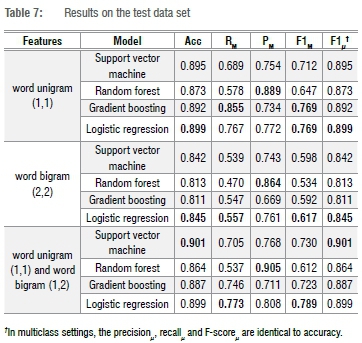
On the test set, the unigram and bigram logistic regression models outperformed all the unigram or bigram models in terms of F-scoreM (0.789). In terms of accuracy, the unigram and bigram support vector classification model scored the highest (0.901) while the unigram and bigram random forest model scored the highest precisionM (0.905). The unigram gradient boosting model scored the highest recallM (0.855).
Experiment 2
In the first experiment, we used word n-gram TF-IDF features. The word unigram model obtained the highest training F-score of 0.736 (s.d.=0.11) for the logistic regression classifier. The same classifier also obtained the highest test F-score of 0.789 using word unigrams and bigrams. For the second experiment, we extracted Word2Vec features and combined the word vector model (100 dimension) with the TF-IDF feature space (unigram) of Experiment 1. Again, model selection was performed on the training data set using 10-fold cross-validation in an exhaustive grid search over the same hyperparameter configurations (see Table 6). The parameters for SVM and random forest stayed the same. For gradient boosting, the learningrate changed from 0.25 to 0.5. For logistic regression, the tolerance for stopping criteria changed from 10 to 1. We report the scores for the event class as we did for Experiment 1 (Table 8).
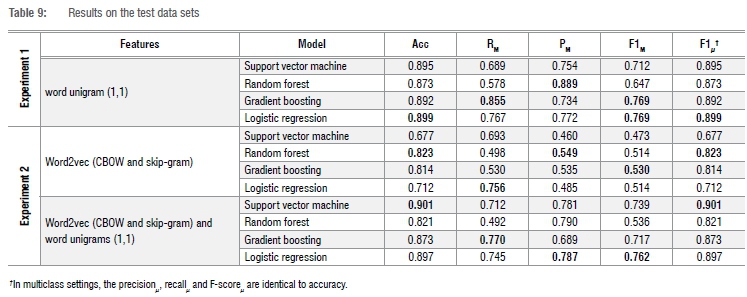
The logistic regression classifier using unigrams with Word2vec features obtained the highest training F-scoreM of 0.723 (s.d. = 0.12). This value is slightly lower than the training F-scoreM of 0.736 (s.d.=0.11) obtained using the word unigram model in Experiment 1. The accuracy and recallM scores were also marginally lower for the logistic regression classifier, but surprisingly the precisionM score was marginally higher with 0.780 (s.d. = 0.16) compared to 0.775 (s.d.=0.15). These results would suggest that adding additional features created by the CBOW and skip-gram Word2vec models did not improve the training performance of the classifiers. We also tested the performance of the four models on the test set, the results of which can be found in Table 9. The models were first tested using embeddings and thereafter embeddings with the unigram model. Again, we included a majority baseline and used the frequency of the majority class (no incident) as accuracy in the training set. The baseline classifier scored 0.541 (accuracy), 0.541 (recall), 0.292 (precision) and 0.379 (F-score) using an average weighted by support (the number of true instances of the label).
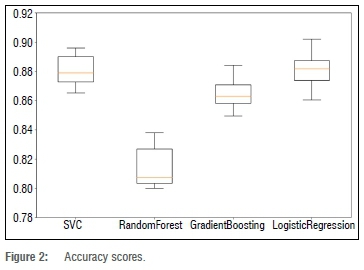
For the test set, the logistic regression classifier using unigrams with Word2vec features obtained the highest test F-scoreM of 0.762. This score was marginally lower than the F-scoreM of 0.769 obtained with the same classifier using only a unigram word model in Experiment 1. Additionally, the test F-scoresM of random forest and gradient boosting classifiers were also lower. Surprisingly, the test accuracy, recallM, precisionM and F-scoreM of the SVM classifier were higher for the unigram word model with Word2vec features. This would suggest that using additional features created by the CBOW and skip-gram Word2Vec models could improve the performance of classification (or prediction) of new data. Figure 2 depicts the accuracy scores of the training set for the algorithms using unigram model with Word2vec features.
Evaluating the machine-learning classifier
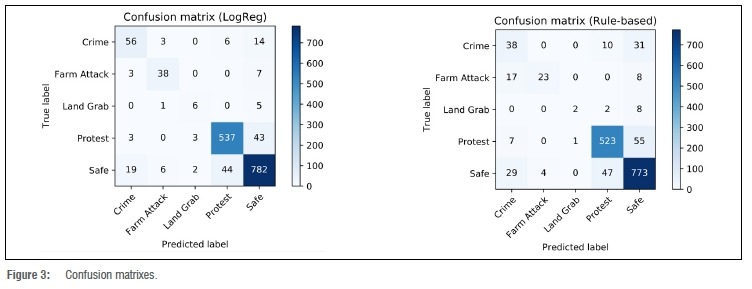
In the exploratory phase of this project, we experimented with a rule-based system that classifies messages in the abovementioned four categories based on the occurrence of certain key terms. We compiled dictionaries using unigrams and bigrams and classified messages as 'unsafe' and according to category based on whether these terms appeared (e.g. 'robbery', 'unrest', 'throwing rocks', 'burning tires'). Because no annotated data was available, we could not measure the accuracy of this rule-based classifier. In an effort to better understand the performance of the classifier, we compared our machine-learning classifier with the rule-based system. The machine-learning classifier and the rule-based classifier were both evaluated using the same testing data set (n = 1578). The logistic regression classifier (using unigrams) achieved an accuracy of 89.73%, and the rule-based classifier reached 86.12%. The same tendency was observed when comparing the F-scores. The logistic regression classifier obtained an F-scoreM of 0.770 and the rule-based classifier 0.621. The confusion matrixes from the classification test are depicted in Figure 3.
Conclusions and future research
We have presented an approach to automatically classify violent events taking place in South Africa. Our aim was to find the best word model on event detection using WhatsApp messages. Our experiment shows the weakness of these algorithms when applied to a highly imbalanced data set. Additionally, we also used word embeddings created with Word2Vec, using both CBOW (sg=0) and (sg=1) skip-gram models. Our experiments have shown that more work is required to find a universal approach to solving the imbalanced distribution problem in this domain. However, we did train a logistic classifier using unigram, CBOW and skip-gram Word2Vec models that achieved a higher accuracy and F1-score than did the rule-based classifier. Possible future research includes employing Doc2Vec33, which is an extension of Word2Vec. Pre-trained English and Afrikaans word vectors such as fastText47 could also be considered, and would thus create a multilingual pre-trained word vector space for the classifiers.
Acknowledgements
We acknowledge the annotation efforts of staff and students at the University of the Free State. We also thank the anonymous reviewers for their helpful comments and advice.
Authors' contributions
E.K.: Project leadership, conceptualisation, methodology, data analysis, data curation, validation, writing - the initial draft, writing - revisions. B.S.: Conceptualisation, data collection, writing - revisions. W.D.: Methodology, validation, writing - revisions.
References
1. Stieglitz S, Mirbabaie M, Ross B, Neuberger C. Social media analytics - Challenges in topic discovery, data collection, and data preparation. Int J Inf Manage. 2018;39(October):156-168. https://doi.org/10.1016/j.ijinfomgt.2017.12.002 [ Links ]
2. Gundecha P Liu H. Mining social media: A brief introduction. In: Tutorals in operations research. Catonsville, MD: INFORMS; 2012. p. 1-17. https://doi.org/10.1287/educ.1120.0105 [ Links ]
3. Sarkar D. Text analytics with Python : A practical real-world approach to gaining actionable insights from your data. New York: Apress; 2016. http://doi.org/10.1007/978-1-4842-2388-8 [ Links ]
4. Aggarwal CC, Zhai C. A survey of text classification algorithms. In: Aggarwal CC, Zhai C, editors. Mining text data. Boston, MA: Springer; 2012. p. 163-222. https://doi.org/10.1007/978-1-4614-3223-4_6 [ Links ]
5. Liu B, Zhang L. A survey of opinion mining and sentiment analysis. In: Aggarwal CC, Zhai C, editors. Mining text data. Boston, MA: Springer; 2012. p. 415-463. https://doi.org/10.1007/978-1-4614-3223-4_13 [ Links ]
6. Liu B. Sentiment analysis and opinion mining. Synth Lect Hum Lang Technol. 2012;5(1):1-167. https://doi.org/10.2200/S00416ED1V01Y201204HLT016 [ Links ]
7. Sebastiani F. Machine learning in automated text categorization. ACM Comput Surv. 2002;34(1):1-47. https://doi.org/10.1145/505282.505283 [ Links ]
8. Ingersoll G, Morton T, Farris A. Taming text: How to find, organize, and manipulate it. Shelter Island, NY: Manning Publications Co; 2013. [ Links ]
9. Sinoara RA, Camacho-Collados J, Rossi RG, Navigli R, Rezende SO. Knowledge-enhanced document embeddings for text classification. Knowledge-Based Syst. 2019;163:955-971. https://doi.org/10.1016/j.knosys.2018.10.026 [ Links ]
10. Bueno de Mesquita B. The war trap. New Haven, CT: Yale University Press; 1981. [ Links ]
11. Bueno de Mesquita B, Newman D, Rabushka A. Forecasting political events: The future of Hong Kong. New Haven, CT: Yale University Press; 1985. [ Links ]
12. Bueno de Mesquita B, Stockman FN. European community decision making. New Haven, CT: Yale University Press; 1994. [ Links ]
13. O'Brien SPP Crisis early warning and decision support: Contemporary approaches and thoughts on future research. Int Stud Rev. 2010;12(1):87-104. https://doi.org/10.1111/j.1468-2486.2009.00914.x [ Links ]
14. Abdollahian M, Baranick M, Efird B, Kugler J. Senturion: A predictive political simulation model [document on the Internet]. c2006 [cited 2018 Aug 20]. Available from: http://www.ndu.edu/CTNSP/Def_Tech/DTP32S%0Aenturion.pdf [ Links ]
15. Esty DC, Goldstone JA, Gurr TR, Surko P Unger AN. State failure task force report. McLean, VA: Science Applications International Corporation; 1995. [ Links ]
16. Bates RH, Epstein DL, Goldstone JA, Gurr TR, Harff B, Kahl CH, et al. Political instability task force report: Phase IV findings. McLean, VA: Science Applications International Corporation; 2003. [ Links ]
17. Goldstone JA, Bates RH, Epstein DL, Gurr TR, Lustik MB, Marshall MG, et al. A global model for forecasting political instability. Am J Pol Sci. 2010;54(1):190-208. https://doi.org/10.1111/j.1540-5907.2009.00426.x [ Links ]
18. Raleigh C, Linke A, Hegre H, Karlsen J. Introducing ACLED: An armed conflict location and event dataset. J Peace Res. 2010;47(5):651-660. https://doi.org/10.1177/0022343310378914 [ Links ]
19. Sundberg R, Melander E. Introducing the UCDP georeferenced event dataset. J PeaceRes.2013;50(4):523-532.https://doi.org/10.1177/0022343313484347 [ Links ]
20. Croicu M, Sundberg R. UCDP GED Codebook version 17.1. Uppsala: Department of Peace and Conflict Research, Uppsala University; 2017. [ Links ]
21. Salehyan I, Hendrix CS, Hamner J, Case C, Linebarger C, Stull E, et al. Social conflict in Africa: A new database. Int Interact. 2012;38(4):503-511. https://doi.org/10.1080/03050629.2012.697426 [ Links ]
22. Schrodt PA. Precedents, progress, and prospects in political event data. Int Interact. 2012;38(4):546-569. https://doi.org/10.1080/03050629.2012.697430 [ Links ]
23. Gerner DJ, Schrodt PA, Francisco RA, Weddle JL. Machine coding of event data using regional and international sources. Int Stud Q. 1994;38(1):91. https://doi.org/10.2307/2600873 [ Links ]
24. Hendrix CS, Salehyan I. No news is good news: Mark and recapture for event data when reporting probabilities are less than one. Int Interact. 2015;41 (2):392-406. https://doi.org/10.1080/03050629.2015.982117 [ Links ]
25. Anonymous. Study finds Facebook news use declining, WhatsApp growing [Internet]. SABC News. 2018 June 14 [cited 2018 Oct 01]. Available from: http://www.sabcnews.com/sabcnews/study-finds-facebook-news-use-declining-whatsapp-growing/ [ Links ]
26. Newman N, Fletcher R, Levy DAL, Nielsen RK. Digital News Report 2018. Oxford: Reuters Institute; 2018. [ Links ]
27. Anonymous. South Africans turn to technology to fight crime [webpage on the Internet]. c2015 [cited 2018 Nov 30]. Available from: http://visiontactical.co.za/2015/07/08/south-africans-turn-to-technology-to-fight-crime/ [ Links ]
28. Haddi E, Liu X, Shi Y The role of text pre-processing in sentiment analysis. Procedia Comput Sci. 2013;17:26-32. https://doi.org/10.1016/j.procs.2013.05.005 [ Links ]
29. Dey L, Haque SM. Opinion mining from noisy text data. Int J Doc Anal Recognit. 2009;12(3):205-226. https://doi.org/10.1007/s10032-009-0090-z [ Links ]
30. Bird S, Klein E, Loper E. Natural language processing with Python. Vol. 43. Sebastopol, CA: O'Reilly; 2009. [ Links ]
31. Cohen J. A coefficient of agreement for nominal scales. Educ Psychol Meas. 1960;20(1):37-46. https://doi.org/10.1177/001316446002000104 [ Links ]
32. Indurkhya N, Damerau FJ. Handbook of natural language processing. 2nd ed. Boca Raton, FL: CRC Press; 2010. [ Links ]
33. Le QV., Mikolov T. Distributed representations of sentences and documents. In: Proceedings of the 31st International Conference on Machine Learning; 2014 June 21-26; Beijing, China. Red Hook, NY: Curran Associates, Inc.; 2014. p. 1188-1196. [ Links ]
34. Goodfellow I, Bengio Y Courville A. Deep learning: Machine learning book [homepage on the Internet]. c2016 [cited 2019 Aug 19]. Available from: http://www.deeplearningbook.org/ [ Links ]
35. Ram A, Nagappan M. Supervised sentiment classification with CNNs for diverse SE datasets [article on the Internet]. c2018 [cited 2019 Jan 17]. Available from: https://arxiv.org/abs/1812.09653?context=cs [ Links ]
36. Mikolov T, Sutskeve I, Chen K, Corrado G, Dean J. Distributed representations of words and phrases and their compositionality. In: Burges CJC, Bottou L, Welling M, editors. Advances in neural information processing systems 26: 27th Annual Conference on Neural Information Processing Systems; 2013 December 0508; Lake Tahoe, Nevada, USA. Red Hook, NY: Curran Associates, Inc.; 2013. p. 3111-3119. [ Links ]
37. Mäntylä MV Graziotin D, Kuutila M. The evolution of sentiment analysis -A review of research topics, venues, and top cited papers [article on the Internet]. 2016;abs/1612.0. Available from: http://arxiv.org/abs/1612.01556 [ Links ]
38. Pedregosa F, Woquaux G, Gramfort A, Michel V Thirion B, Grisel O, et al. Scikit-learn: Machine learning in Python. J Mach Learn Res. 2011;12:2825-2830. [ Links ]
39. He H, Garcia EA. Learning from imbalanced data. IEEE Trans Knowl Data Eng. 2009;21(9):1263-1284. https://doi.org/10.1109/TKDE.2008.239 [ Links ]
40. Lemaítre G, Nogueira F, Aridas CK. Imbalanced-learn: A Python toolbox to tackle the curse of imbalanced datasets in machine learning. J Mach Learn Res. 2017;18(17):1-5. [ Links ]
41. Raschka S, Mirjalili V Python machine learning: Machine learning and deep learning with Python, scikit-learn, and TensorFlow. 2nd ed. Birmingham, UK: Packt Publishing; 2017. [ Links ]
42. Chang C, Lin C. LIBSVM. ACM Trans Intell Syst Technol. 2011;2(3):1-27. https://doi.org/10.1145/1961189.1961199 [ Links ]
43. Chollet F. Deep learning with Python. Shelter Island, NY: Manning Publications Co.; 2017. [ Links ]
44. Oza NC, Tumer K. Classifier ensembles: Select real-world applications [article on the Internet]. Inf Fusion. 2008;9(1):4-20. Available from: https://linkinghub.elsevier.com/retrieve/pii/S1566253507000620 [ Links ]
45. Sokolova M, Lapalme G. A systematic analysis of performance measures for classification tasks. Inf Process Manag. 2009;45(4):427-437. https://doi.org/10.1016/j.ipm.2009.03.002 [ Links ]
46. scikit-learn developers. Model evaluation: Quantifying the quality of predictions. No date [cited 2019 Oct 20]. Available from: https://scikit-learn.org/stable/modules/model_evaluation.html [ Links ]
47. Bojanowski P Grave E, Joulin A, Mikolov T. Enriching word vectors with subword information. Trans Assoc Comput Linguist. 2017;5:135-146. https://doi.org/10.1162/tacl_a_00051 [ Links ]
 Correspondence:
Eduan Kotzé
kotzeje@ufs.ac.za
Received: 28 Aug. 2019
Revised: 22 Oct. 2019
Accepted: 01 Nov. 2019
Published: 26 Mar. 2020
Editor: Tania Douglas
Funding: None
