


Services on Demand
Journal

Article
 English (pdf)
 Article in xml format
 Article references
 Send this article by e-mail
Indicators
Related links
-
 Cited by Google
 -
 Similars in Google
Share

 Permalink
South African Journal of Science
On-line version ISSN 1996-7489Print version ISSN 0038-2353
S. Afr. j. sci. vol.110 n.1-2 Pretoria Jan. 2014
COMMENTARY
Flaws in the approach and application of the Equity Index: Comments on Govinder et al. (2013)
Tom A. Moultrie; Rob E. Dorrington
Centre for Actuarial Research (CARe), University of Cape Town, Cape Town, South Africa
Transformation of South African society post-apartheid, which includes higher education institutions (HEIs), is a national imperative, but it is a complex process which cannot, and possibly should not, be encapsulated in a single index, particularly one as poorly conceived, applied and interpreted as that presented by Govinder, Zondo and Makgoba1 (and Govinder and Makgoba2 before that). While these publications and some extreme interpretations of the results by the authors at various fora may have the benefit of stimulating debate, there is a very real risk that such reductionist monitoring could very well undermine, rather than encourage, the process of transformation.
Although the concept of an 'Equity Index' (EI) was initially presented in Scientific Correspondence in this journal by Govinder and Mokgoba2, the idea was presented and expanded upon in more detail in the more recently published paper by Govinder et al.1, and it is on this paper that most of our comments focus. The expanded paper applies the index to determine the extent of the deviation from a benchmark demographic profile of staff and students at 23 HEIs in South Africa in 2011. Apart from ranking the institutions on various components of staff and students, they also compute what they refer to as an 'equity-weighted research index' which purportedly adjusts research output for equity. In terms of instructional/research professional (IRR i.e. 'academic') staff, which was the major focus of their paper, they found that although no institution had a satisfactory EI, by splitting the ranges of the Eis and of output per capita of the HEIs into two halves, only two institutions - the University of Fort Hare (UFH) and the University of KwaZulu-Natal (UKZN) - were located in the best quadrant (that represents the lowest EI and highest output per capita). In terms of student profiles, they argue that, apart from no university having a satisfactory El, all but three universities had higher (worse) graduation EIs than enrolment Els, singling out five as showing a 'dramatic worsening'. From these results, the authors draw a number of often extreme and ill-reasoned conclusions.
Unfortunately, apart from the questionable mission of the paper, the authors make a number of algebraic, computational and conceptual errors in the implementation and interpretation of their index, which all but negate most of the arguments for and from the index. In fact it is quite surprising that a paper with so many flaws was deemed good enough to be published.
Algebraic and statistical errors
The El proposed by Govinder et al. is based on a simple measure of distance, the root sum of squared differences (RSSD), which can be expressed more meaningfully than they do as follows:
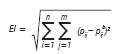
where pij represents the percentage of the institution's population in population group i = {African; Coloured; Indian; White} and sexj = {male; female}, and pijb represents the corresponding percentages in the benchmark population.
A detailed critique of the inappropriateness of using percentages or proportions as a measure of distance in an RSSD index, including the problem that it treats departures from the benchmark percentage in each category as being equivalent, and other criticisms have been offered by Dunne3. We do not intend to cover these criticisms. Instead, we confine ourselves to still further problems with the El as implemented by the authors.
The first problem with the calculation of the El is that, instead of the formulation above, the authors have calculated the EI as
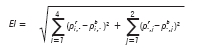
Despite the authors' assertion that either method of calculating the index 'is relevant'1, their approach double counts and is not mathematically correct. Correcting for this error has the effect of reducing all the EIs by approximately 30%. If the primary concern is simply the ranking of the universities (as opposed to drawing any other conclusions) the correction does not change those rankings, but it does impact, inter alia, the maximum determined values of the El; the relationship between research output per capita and El; and the demarcation of the quadrants, and hence the conclusions drawn from partitioning the plot area into quadrants.
To compound their computational error, the authors excluded from the benchmark what they assumed were 'foreigners' (an issue dealt with in greater detail below) without re-estimating the percentages so that the percentages in the benchmark do not sum to 100%. This approach makes it impossible for the El to be zero.
More substantive issues arise when the authors apply the derived EIs and attempt to draw inferences and implications therefrom. For example, they treat the EIs as additive (they are not) and thus produce what they term an 'equity efficiency index' to measure change by differencing the indices of enrolled students and graduates; or, even more absurdly, they sum the EIs for the various categories of employees (presented in Figure 2 of their paper) to compare universities. The absurdity is compounded by the small numbers of staff in several categories - a problem of which they are aware, but appear to ignore in this instance. For example, they calculate an EI for the 'crafts and trades' group across the 23 HEIs, despite there being fewer than 20 such staff at 13 of the 23 institutions. The resulting proportional distributions by population group and sex are not robust and cannot convey any useful insights.
However, the most worrying misuse of the EI by the authors is their construction of what they call their 'equity-weighted research output' (i.e. total research output divided by the staff (or IRP staff) EI). Apart from the fact that they do not standardise for the size of the institution (using total research output rather than output per capita in the numerator) in their measure, the metric is difficult to interpret, and certainly does not 'weight' for EI. (In passing, it is worth questioning whether it is coincidental that using the equity-weighted research output for IRP staff ranks UKZN as the top university when controlling for size drops it down to eighth.) The difficulty can best be understood by considering what will happen to the equity-weighted research output of an institution that produces some (even the most modest amount) research as the EI approaches the ideal (i.e. zero) - it will tend to infinity. This is clearly neither desirable nor sensible.
Measuring transformation: Who is eligible?
If the proposed EI is to be used to track transformation, the data used in its construction should be presented according to the requirements of South African labour legislation. The Employment Equity Act of 1998 (amended by regulations promulgated in May 20064) adopts a very strict definition of who counts as a member of the 'designated group': non-South Africans who might otherwise be regarded as 'designated' are expressly excluded, as are any foreigners who became naturalised South African citizens after 1994.
The Act's definition of the designated group thus goes far beyond a simple test of citizenship, and the vast majority of foreign-born South African citizens who obtained South African citizenship after 1994 are excluded from the designated group. The proportional distributions used in the calculation of the EI should be determined by the ten categories identified in the Act, but neither the 2011 census data nor the Higher Education Management Information System (HEMIS) database on staff employed at South African HEIs permit the appropriate analysis of the data in this form. It is therefore not possible for the EI to be calculated from the data available in a manner consistent with South African legislation. (The HEMIS data are available through the Higher Education Data Analyser. Using the data available we are able to reproduce very closely the results produced for 2011 by Govinder et al.1 Somewhat curiously, we cannot reproduce at all closely the results presented for 2007 in the authors' presentation to Parliament's Higher Education Committee.5)
Restricting the calculation of the EI to only South African citizens (possible with both the 2011 census and HEMiS data) would go some way to aligning the EI more closely with the requirements of South African labour legislation, although those who took citizenship after 1994 would be erroneously included as a result. However, there are two further problems with doing this. Firstly, other comparisons based on the EI, particularly the analysis of research output per capita, would be invalidated as this research output would then also have to be restricted to include only that produced by South Africans. Secondly, excluding foreign nationals from the EI entirely would mean that HEIs could increasingly employ staff from this group (so they constitute an increasing proportion of all staff) and still improve their equity profile by ensuring that the (diminishing proportion) remaining are increasingly drawn from the designated groups. This too would not encourage meaningful transformation of staff bodies.
Problems with the data on higher educational institutions
In addition to the algebraic and statistical errors outlined above, there are three further problems inherent to the data on staff at South African HEIs as presented in the HEMIS database.
Firstly, it is not clear how Govinder et al. dealt with staff for whom population group was unclassified. For example, approximately 12% of IRP staff at UKZN did not have their population group recorded in 2011. Likewise, in the data for the University of Cape Town (UCT) for 2007, more than a quarter of IRP staff were 'unclassified'. It would appear that those staff were either ignored (as was done nationally) or the percentages in the classified groups increased to sum to 100%, neither of which are satisfactory.
Secondly, because the HEMIS data rely on information submitted by institutions, the data are heavily affected by the classifications used by those institutions, and by institutional policies relating to outsourcing of certain activities. As two examples, 17% of all staff at HEIs in South Africa in 2011 classified as 'Executive/Administrative or Management Professionals' would appear to have been employed at a single institution - the University of Pretoria - while nearly a third (31%) of all 'Technical' staff employed by universities in 2011 were at UkZN. In a similar vein, UCT has one of the smallest complements of service staff (140 reported in 2011), no doubt the result of that institution outsourcing most of this work. The utility of including clearly problematic categories such as those described above in any comparative measure of transformation is questionable.
Problems with the benchmark(s) used
In addition to the problem that the 2011 census data do not allow for data to be extracted that conforms to the requirements of South African labour legislation, there are further conceptual issues with the benchmarks proposed.
Instructional/research professional staff
For their benchmark for instructional/research professional (academic) staff, Govinder et al. propose using the distribution by population group and sex of the population as a whole aged 24-65 from the 2011 census. There are several important aspects to these data which would appear not to have been considered by the authors.
Firstly, they have confused the census questions relating to citizenship and population group, implying that the 0.6% of people in the census who are coded as population group 'Other' are not South African citizens. This assumption is incorrect. Nearly half of all people aged 25-64 coded as 'Other' in terms of population group are South African citizens, while over a million non-citizens aged 25-64 classified themselves in terms of population group.6 (Statistics South Africa's online database does not permit the extraction of citizenship status of those aged 24-65 (as used in the original paper), only that in conventional 5-year age groups. The effect of the slight difference in classification of ages is likely to be trivial.) The census data suggest that around 4.6% of the population aged 25-64 are foreign nationals, with a further 2.3% not being classifiable in terms of population group and/or citizenship. The resulting distributions underlying the benchmark proportions are rather different from those presented in Govinder et al.'s paper (Table 1).
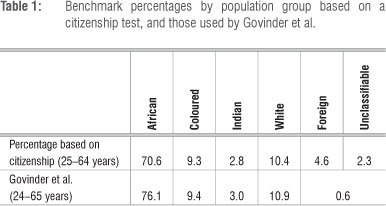
It must be re-emphasised that the figure of 4.6% for foreign nationals would be an underestimate of the proportion deemed 'not designated' in terms of the Employment Equity Act, as most of the foreign-born who obtained South African citizenship after 1994 should be included in the 'Foreign' category for employment equity purposes, as described earlier. It is also important to note that 2.3% of the census population aged 25-64 could not even be accurately classified in terms of citizenship and population group, let alone in terms of the finer gradations required by the legislation.
While nationally the proportion of foreigners may be unremarkable, many HEIs have a significant component of 'International' staff. At UCT, for example, in each of 2010, 2011 and 2012, a quarter of academic staff are classified as 'International' in terms of labour legislation.7 This observation brings into sharp focus the tension caused by the proposed EI between institutions hiring the most suitable candidate for a post, globally, with a view to offering the best possible training to students and best advancing the development of South Africa and the continent, and a much narrower, parochial, mindset that the EI would seek to engender, because any institution with a large complement of 'International' staff will, by definition, perform poorly based on the EI. A naïve focus on the EI would serve to punish institutions that seek to recruit the globally best staff.
Secondly, the authors assert that the chosen benchmark is further justified because 'universities are responsible for ensuring that this age group is suitably qualified'1. This assertion ignores the long-term consequences of apartheid education: matric exemption rates (which determine the enrolment profile of first-year students -'passing' matric does not automatically confer university exemption, a point neglected by the authors) differ markedly by population group. Even if the ongoing crisis in primary and secondary education (as evidenced by the recently released results of the Annual National Assessment8) was resolved immediately, there would be a lag of nearly two decades before those entering school in 2014 had completed a postgraduate education.
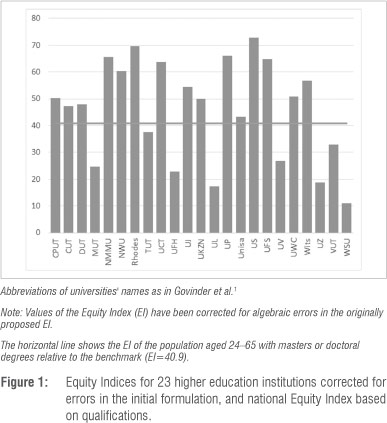
Thirdly, although a benchmark based on the proportion of the population by sex and population group in possession of a higher degree might seem a sensible alternative, it is not really. Those with higher degrees in South Africa are overwhelmingly White (and male), so benchmarking against this population would have the perverse effect of penalising institutions that have fewer White staff and are closer to the national demographic profile. Nonetheless, the EI of this alternative against the national benchmark offers an approximate indication of the extent of the structural/systemic component of the institutional EIs. The EI for the population with higher degrees relative to the benchmark population aged 24-65 is 40.9, about half the range of the correctly calculated EIs of universities. As can be seen from Figure 1, 15 of the 23 HEIs have an EI greater than this value, suggesting that - even relative to that alternative benchmark - they are relatively 'untransformed'. It is important to note, however, that Figure 1 also suggests that a large part of the 'transformation problem' described by Govinder et al.'s analysis results from structural rather than institutional causes, and that the structural nature of who currently has higher degrees in South Africa contributes more to the overall index than institutional specificities do.
Comparing the distribution of IRP staff by level of qualifications at the eight institutions with EIs that fall below the line, combined, against that of IRP staff at the eight institutions with the highest EIs, it is evident that the staff at the 'more transformed' institutions are much less qualified than those at the 'less transformed' institutions (Table 2).
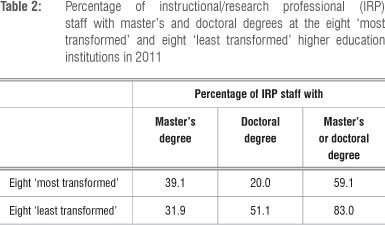
This finding suggests that universities could achieve greater levels of 'transformation' simply by employing less-qualified staff - an approach unlikely to be in the long-term developmental interests of the country as a whole, or of the higher education sector specifically.
Student profiles and administrative staff
The authors argue that the national rather than provincial demographic profile of people aged 17-40 who have a matric should be used for the calculation of EIs for the student body at HEIs. The HEMIS data on full-time equivalent (FTE) student enrolments at HEIs in 2011 suggest otherwise. Universities draw their students primarily from the region in which they are located.
For example, while around 3.5% of the national population aged 17-40 with a matric in 2011 were Indian (Table 2 from Govinder et al.), Indians comprised about 5.6% of the national FTE student enrolment in 2011, and, at UKZN, Indians in 2011 accounted for no less than 29.6% of the FTE student population. In no possible way is this more 'a microcosm of the nation rather than the region' as Govinder et al.1 claim, mentioning UKZN specifically. Likewise, according to their reasoning, Coloured students are hugely over-represented at all institutions in the greater Cape Town area and at Nelson Mandela Metropolitan University. The controversy engendered by former Director-General of Labour Jimmy Manyi's comments in 20109 about the 'over-concentration' of Coloureds in the Western Cape springs to mind.
A similar observation applies to the argument that national rather than provincial benchmarks should be used in the calculation of the Equity Index for administrative staff: HEIs are most likely to draw such staff from their surrounding communities. The recent decision of the Cape Town Labour Court10 in the case brought by certain prison warders against the Department of Correctional Services determined that regional, rather than national, demographic profiles must be taken into account in setting employment targets.
Research output, quality and transformation
The authors understand that there could be tension between output/ productivity and transformation of staff. They seek to investigate this tension by considering the relationship between research output and the EI. However, apart from the problems with their efforts, mentioned above, the authors assume all research output units are equivalent. This is evidently false. Thus, considering accredited research outputs, the assumption is made that a qualifying, but very brief, article in, for example, the South African Journal of Science is the equal of a 20-page article in Nature. Also implicit in their analysis is the assumption that all postgraduate degrees are of equal quality regardless of the awarding institution (never mind what proportions find employment or proceed to higher degrees, or whether standards are being maintained when an institution triples or quadruples output over the span of 4 or 5 years without significant changes to staff, etc.). Clearly neither is true, nor can the metric used offer any indication of the potential contribution to the national project. Thus one notes that the only university to appear in the 'best' quadrant (lower than mid-range (correctly calculated) El and higher than mid-range output per capita), fails to make any impression on international systems of ranking of HEIs.
The assessment of performance allowing for any impact of moving towards national racial profiles as envisaged by the El requires classifying output by whatever equity categories are used. However, unless one also controls for rank or age, this approach would serve only to bolster the argument that transformation takes place at the expense of output, as output is a function (to a large extent) of seniority.
It is also worth noting that Govinder et al.1 identify a cluster of 8-11 institutions with the lowest EIs which they claim 'adds no value to national development', and are characterised by 'equity transformation without quality'. Their statements are problematic for a number of reasons. Firstly, these are apartheid legacy institutions, which have not 'transformed' but have rather historically always employed a high proportion of Black South Africans and have never produced large numbers of graduates with higher degrees or much research. Secondly, universities of technology have a markedly different role to play relative to comprehensive and traditional universities, and should not really be compared with these HEIs. Nonetheless, if the institutions that are 'most transformed' are indeed those that add least to national development, then it is not clear at all that a lower EI is something to which to aspire.
Misuse and misinterpretation of the Equity Index
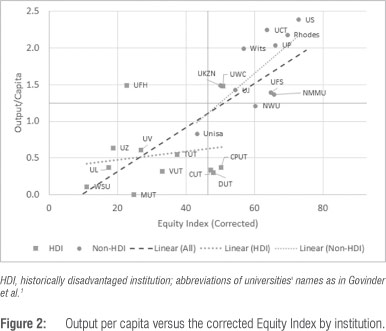
The authors claim that 'there is no direct linear correlation between EI ranking and research productivity'. Inspection of Figure 2, which plots the output per capita of each university against the correctly calculated EI, shows that this claim is patently false. There is a clear linear trend, not only considering all universities, but, perhaps more pertinently, after excluding the group of '8-11 universities' that the authors argue 'adds no value to national development'.
A second feature which can be noted from Figure 2 is that if we split the plot area into four quadrants using the El and output per capita of all institutions combined to determine the quadrants rather than the more arbitrary approach used by Govinder et al.1, only the University of Fort Hare lies in the most desirable quadrant (bottom half EI, top half output per capita). In addition, the five institutions (which coincidentally include UKZN) identified by the authors as having 'the greatest potential for exhibiting good equity and high productivity' because they were found to be clustered around the centre of the plot, no longer cluster around the centre of the plot.
Turning to their application of the EI metrics to the student population, the authors argue, on the basis that the 'enrolment El' exceeds the 'graduation El' for all but three universities, that there is 'a definite equity profile of students dropping out of universities nationally'. However, while selective dropping out may well be occurring, one cannot be sure that this is the explanation for results presented in the paper. Because the comparison is not by year of enrolment (i.e. considering the progress of a cohort of students), this conclusion could be entirely erroneous. In particular, a university which has improved the EI of its student enrolment over recent years would find that its enrolment El exceeded its graduation EI, irrespective of any selective dropping out.
An application of the El not covered in the paper but presented elsewhere by the authors and given significant media coverage,11 is the estimation of the time each institution is expected to take to transform, by calculating the EI at two time points (in their case 4 years apart) and extrapolating the trend linearly to determine when the EI reaches zero. Apart from the inappropriateness of extrapolating, in some cases several hundred years into the future, from only two, potentially arbitrarily chosen, points only four years apart, the authors seem completely oblivious of the fact that employees have rights, academics have tenure, and staff turnover and growth in staff at the most productive universities are low, so to a large extent the demographic profile of the staff is confined to the replacement of older retirees by younger new recruits.
Conclusions
The need for transformation of higher education in South Africa is undisputed. However, a single summary index of the kind proposed by Govinder et al. may obfuscate more than it illuminates. Transformation of the demographic profile of HEIs is but one aspect of a much bigger transformation project. That project should encompass the national development priorities of the country, an understanding of the role and function of HEIs in that developmental agenda, and the role that South African universities, being generally the best in sub-Saharan Africa, can play in facilitating and driving development across the continent. By focusing on winners and losers (via the ranking system) it is probable that efforts will be made by HEIs to 'game' the index, at the expense of the other broader aspects of transformation. Rather, the focus of any metric of this sort should be on the progress of each institution within its circumstances, rather than on how it compares with other institutions.
We reiterate our concern that the EI as proposed, and its extensions to incorporate research output, offers little meaningful in terms of engaging with the question of quality of higher education offered in South Africa. In addition, the proposed EI is conceptually and algebraically flawed, the benchmarks chosen are problematic and the data from which the EI is calculated do not allow it to be presented in a form consistent with South African labour legislation. Finally, there is the possibility that the EI, by benchmarking and through the suggestion that transformation will only be complete when the EI is close to zero, is inconsistent with the recent judgement from the Supreme Court of Appeal which again confirmed that employment quotas contravene the Employment Equity Act.12
While a metric which tracks progress in transformation of staff and students may be of some use in monitoring progress (as opposed to producing league tables comparing institutions), much more work is required to develop a meaningful index. Not only will such an index have to account for more dimensions than the index proposed by Govinder et al., but productivity/output and the quality of that output would need to be taken into account, because, when all is said and done, sight of the primary objective of HEIs, namely, the production of suitably trained/ qualified graduates and research to meet the needs of the country, should never be lost. Any effort to measure progress in transforming the institution should never undermine this primary objective. The development of such an index takes on even greater urgency in the light of the perceived utility of the completely inadequate current attempt to measure transformation at HEIs in South Africa.
Acknowledgements
While we have benefitted much from the input of colleagues at the University of Cape Town, the views presented here are solely those of the authors and do not necessarily reflect those of the University.
References
1. Govinder KS, Zondo NP Makgoba MW. A new look at demographic transformation for universities in South Africa. S Afr J Sci. 2013;109(11/12), Art. #2013-0163, 11 pages. http://dx.doi.org/10.1590/sajs.2013/20130163 [ Links ]
2. Govinder KS, Makgoba MW. An Equity Index for South Africa. S Afr J Sci. 2013;109(5/6), Art. #a0020, 2 pages. http://dx.doi.org/10.1590/sajs.2013/a0020 [ Links ]
3. Dunne T. Mathematical errors, smoke and mirrors in pursuit of an illusion: Comments on Govinder et al. (2013). S Afr J Sci. 2014;110(1/2), Art. #a0047, 6 pages. http://dx.doi.org/10.1590/sajs.2014/a0047 [ Links ]
4. Employment Equity Act of 1988 (Act 55 of 1998). Amendments to the Employment Equity Regulations. Government Gazette. 2006;28858. Pretoria: Government Printer; 2006. [ Links ]
5. Parliamentary Monitoring Group. Equity Index in South African universities: Briefing by Deputy Minister of Higher Education and Training and the Transformation Oversight Committee [homepage on the Internet]. c2013 [updated 2013 Oct 23; cited 2013 Dec 13]. Available from: http://www.pmg.org.za/report/20131023-equity-index-in-south-african-universities-briefing-deputy-minister-higher-education-and-training-and
6. Statistics South Africa. Census 2011 [database on the Internet]. c2011 [cited 2013 Dec 13]. Available from: http://interactive.statssa.gov.za/superweb/login.do
7. University of Cape Town. UCT Teaching and Learning Report. Cape Town: University of Cape Town; 2013. [ Links ]
8. Department of Basic Education. Report on the Annual National Assessment of 2013 [document on the Internet]. c2013 [cited 2013 Dec 13]. Available from: http://www.education.gov.za/LinkClick.aspx?fileticket=Aiw7HW8ccic%3D&tabid=36
9. Manyi: 'Over-supply' of Coloureds in Western Cape. Mail and Guardian [online]. 2011 Feb 24 [cited 2013 Dec 13]. Available from: http://mg.co.za/article/2011-02-24-coloureds-overconcentrated-in-wcape-says-manyi
10. Solidarity and Others v. Department of Correctional Services and Others (C 368/2012, C968/2012) (2013) ZALCCT 38 (2013 Oct 18) [case on the Internet]. [cited 2013 Dec 13]. Available from: http://www.saflii.org/za/cases/ZALCCT/2013/38.html
11. Masondo S. 382 years for SA's top 5 research universities to transform. City Press [online]. 2013 Oct 23 [cited 2013 Nov 28]. Available from: http://www.citypress.co.za/news/382-years-sas-top-5-research-universities-transform/
12. Solidarity obo Barnard v. SAPS (165/2013) (2013) ZASCA 177 (2013 Nov 28) [case on the Internet]. [cited 2013 Dec 13]. Available from: http://www.justice.gov.za/sca/judgments/sca_2013/sca2013-177.pdf
 Correspondence:
Tom Moultrie
Centre for Actuarial Research
University of Cape Town
Private Bag X3, Rondebosch 7701, South Africa
Email: tom.moultrie@uct.ac.za
© 2014. The Authors. Published under a Creative Commons Attribution Licence.
