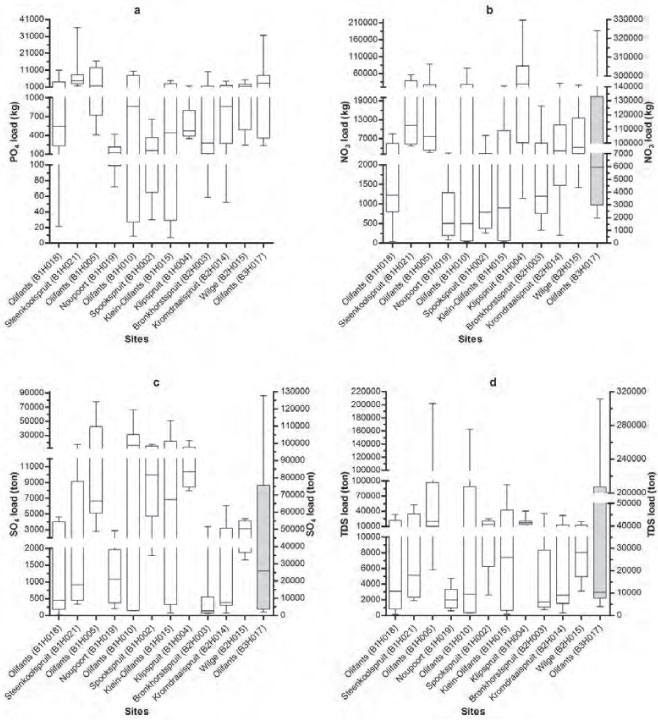
Figure 12
Minimum, 25th, median, 75th and maximum percentiles of annual phosphate, nitrate, sulphate and total dissolved solids loads measured at Department of Water Affairs monitoring sites located in the upper Olifants catchment from 2000 to 2010. Shaded bars are read on the right-hand y-axis