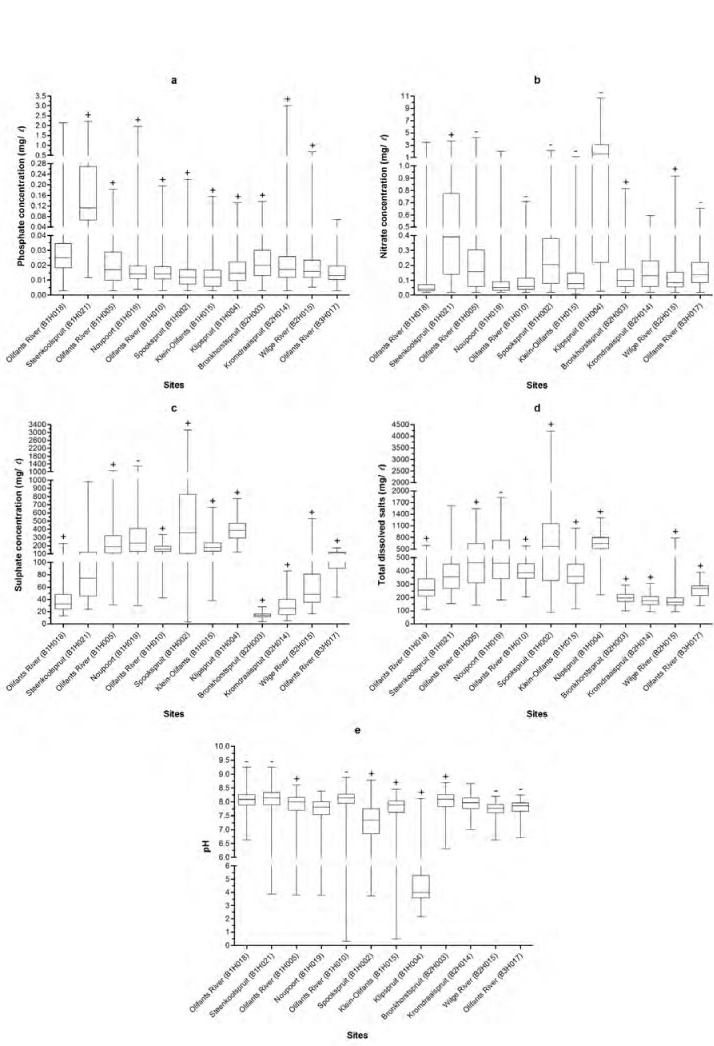
Figure 11
Minimum, 25th, median, 75th and maximum percentiles of phosphate, nitrate, sulphate and total dissolved salts concentrations, and pH, measured at Department of Water Affairs monitoring sites located in the upper Olifants catchment from 1972 to 2010. Positive (+) and negative (-) symbols indicate significant positive and negative trends, respectively.