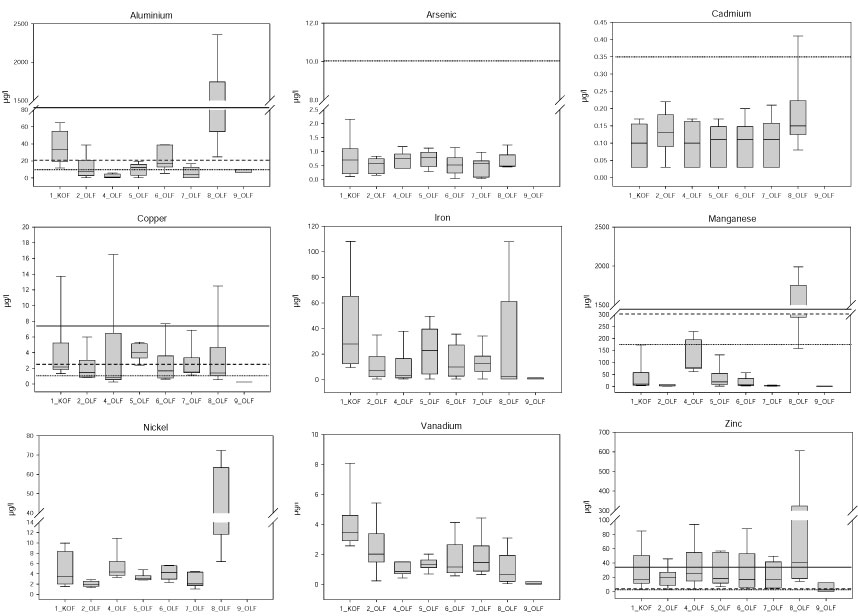
Figure 5
Box and whisker plots of metal concentrations measured at routine monitoring sites along the upper Olifants River (n = 5). Dotted, dashed and solid lines represent the TWQR, CEV and AEV guideline values, respectively, as specified by DWAF (1996).