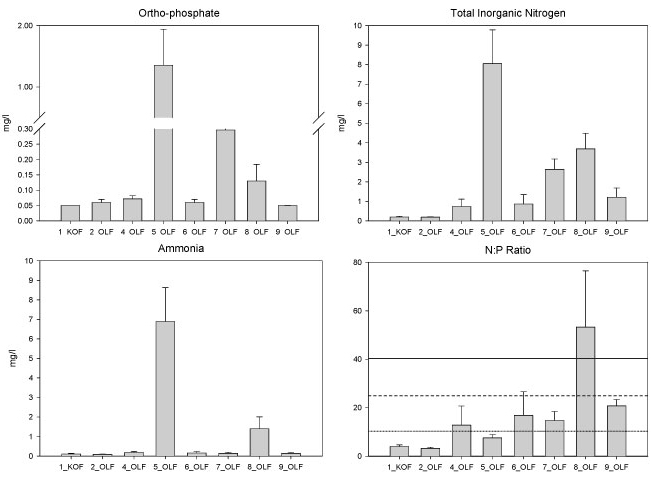
Figure 3
Mean concentrations (ortho-phosphate, total inorganic nitrogen and ammonia) and N:P ratios of nutrients measured at routine monitoring sites along the upper Olifants River (n = 5). Solid, dashed and dotted lines are representative of eutrophic, mesotrophic and oligotrophic status, respectively.